J
Seller's Agent in 2017
Jason Redding
Rosato Management Services
(716) 207-9070
15 Total Sales

Estimated Value: $220,954 - $250,000
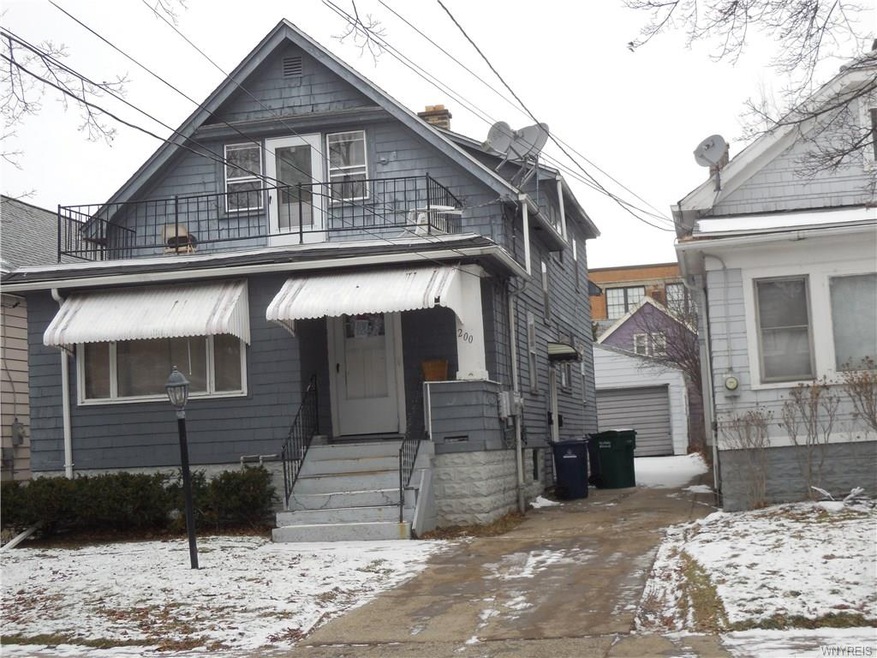
Great 3/2 double. This is a great rental property. Both tenants on 1 year leases. Instantly start making money right away. Newer architect shingle roof, lower has a newer furnace. Very popular neighborhood don't miss out won't last long.
Last Agent to Sell the Property
Listing by Rosato Management Services License #10401220766 Listed on: 03/21/2017
Last Buyer's Agent
Listing by Rosato Management Services License #10401220766 Listed on: 03/21/2017
We collect this data history from publicly available records. To have your information removed, we recommend requesting removal directly through your county’s website.
We collect this data history from publicly available records. To have your information removed, we recommend requesting removal directly through your county’s website.
| Date | Buyer | Sale Price | Title Company |
|---|---|---|---|
| $67,000 | None Available | ||
| $54,900 | None Available | ||
| $9,000 | None Available |
We collect this data history from publicly available records. To have your information removed, we recommend requesting removal directly through your county’s website.
| Date | Status | Borrower | Loan Amount |
|---|---|---|---|
| Open | $10,500 |
We collect this data history from publicly available records. To have your information removed, we recommend requesting removal directly through your county’s website.
| Date | Event | Price | List to Sale | Price per Sq Ft |
|---|---|---|---|---|
| 07/07/2017 07/07/17 | Sold | $75,000 | +7.3% | $37 / Sq Ft |
| 06/01/2017 06/01/17 | Pending | -- | -- | -- |
| 05/16/2017 05/16/17 | For Sale | $69,900 | 0.0% | $34 / Sq Ft |
| 03/31/2017 03/31/17 | Pending | -- | -- | -- |
| 03/21/2017 03/21/17 | For Sale | $69,900 | -- | $34 / Sq Ft |
We collect this data history from publicly available records. To have your information removed, we recommend requesting removal directly through your county’s website.
| Year | Tax Paid | Tax Assessment Tax Assessment Total Assessment is a certain percentage of the fair market value that is determined by local assessors to be the total taxable value of land and additions on the property. | Land | Improvement |
|---|---|---|---|---|
| 2025 | $381 | $174,000 | $7,000 | $167,000 |
| 2024 | $381 | $68,000 | $4,500 | $63,500 |
| 2023 | $345 | $68,000 | $4,500 | $63,500 |
| 2022 | $342 | $68,000 | $4,500 | $63,500 |
| 2021 | $342 | $68,000 | $4,500 | $63,500 |
| 2020 | $416 | $68,000 | $4,500 | $63,500 |
| 2019 | $1,482 | $54,000 | $6,000 | $48,000 |
| 2018 | $1,394 | $54,000 | $6,000 | $48,000 |
| 2017 | $321 | $54,000 | $6,000 | $48,000 |
| 2016 | $1,314 | $54,000 | $6,000 | $48,000 |
| 2015 | -- | $54,000 | $6,000 | $48,000 |
| 2014 | -- | $54,000 | $6,000 | $48,000 |
J
Seller's Agent in 2017
Jason Redding
Rosato Management Services
(716) 207-9070
15 Total Sales
Source: Western New York Real Estate Information Services (WNYREIS)
MLS Number: B1032889
APN: 140200-079-660-0003-048-000
Disclaimer: Certain information contained herein is derived from information provided by parties other than Homes.com. All information provided is deemed reliable, but is not guaranteed to be accurate and should be independently verified.
![]() The data relating to real estate on this web site comes in part from the Internet Data Exchange (IDX) Program of the CNYIS, UNYREIS and WNYREIS. Real estate listings held by firms other than Homes.com, LLC are marked with the IDX logo and include the Listing Broker’s Firm Name.
The data relating to real estate on this web site comes in part from the Internet Data Exchange (IDX) Program of the CNYIS, UNYREIS and WNYREIS. Real estate listings held by firms other than Homes.com, LLC are marked with the IDX logo and include the Listing Broker’s Firm Name.
Disclaimer: All information deemed reliable but not guaranteed and should be independently verified. All properties
are subject to prior sale, change or withdrawal. Neither the listing broker(s) nor Homes.com, LLC shall be responsible for any typographical errors, misinformation, misprints, and shall be held totally harmless.
© 2026 CNYIS, UNYREIS, WNYREIS. All rights reserved.
Ask me questions while you tour the home.
