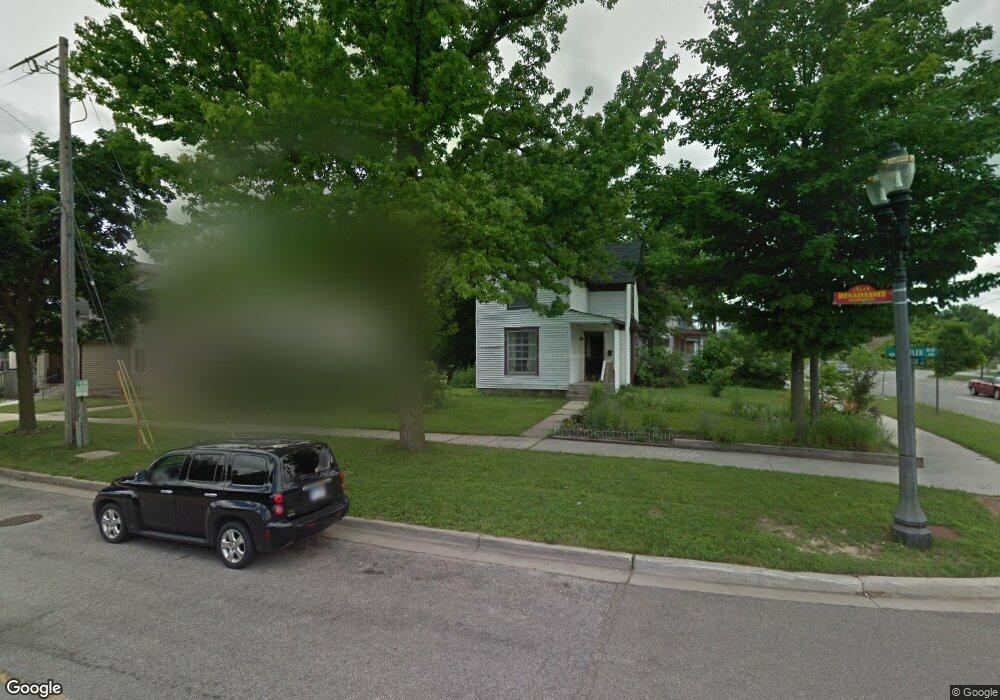
200 S Butler Blvd Lansing, MI 48915
Downtown Lansing NeighborhoodEstimated Value: $133,000 - $162,000
5
Beds
1
Bath
1,560
Sq Ft
$91/Sq Ft
Est. Value
About This Home
This home is located at 200 S Butler Blvd, Lansing, MI 48915 and is currently estimated at $141,517, approximately $90 per square foot. 200 S Butler Blvd is a home located in Ingham County with nearby schools including Riddle Elementary School, Pattengill Academy, and J.W. Sexton High School.
Ownership History
Date
Name
Owned For
Owner Type
Purchase Details
Closed on
Apr 28, 2025
Sold by
Bailey Clifford
Bought by
Bailey Estella
Current Estimated Value
Purchase Details
Closed on
Oct 11, 2018
Sold by
Bailey Tyron
Bought by
Bailey Clifford D
Purchase Details
Closed on
Feb 28, 2014
Sold by
Bailey Tyron
Bought by
Bailey Clifford and Bailey Tyron
Purchase Details
Closed on
May 11, 2013
Sold by
Land Holdings Llc
Bought by
Bailey Tyron
Purchase Details
Closed on
Aug 10, 2012
Sold by
Independent Bank
Bought by
Land Holdings Llc
Purchase Details
Closed on
Dec 22, 2011
Sold by
Laf Investments Llc
Bought by
Independent Bank
Purchase Details
Closed on
Apr 21, 2000
Sold by
Laf Investments Llc
Bought by
Wrigley Mary and Mary Wrigley Trust
Purchase Details
Closed on
Jan 8, 1999
Sold by
Farhat Leo A
Bought by
Laf Investments Llc
Purchase Details
Closed on
Jan 6, 1998
Sold by
Abraham Charles J
Bought by
Farhat Leo
Purchase Details
Closed on
May 26, 1993
Sold by
Payne Ruth
Bought by
Hudson Joseph T and Hudson Nellie P
Create a Home Valuation Report for This Property
The Home Valuation Report is an in-depth analysis detailing your home's value as well as a comparison with similar homes in the area
Home Values in the Area
Average Home Value in this Area
Purchase History
| Date | Buyer | Sale Price | Title Company |
|---|---|---|---|
| Bailey Estella | -- | None Listed On Document | |
| Bailey Clifford D | -- | None Available | |
| Bailey Clifford | -- | None Available | |
| Bailey Tyron | $23,100 | None Available | |
| Land Holdings Llc | -- | None Available | |
| Independent Bank | $41,118 | None Available | |
| Wrigley Mary | -- | -- | |
| Laf Investments Llc | -- | -- | |
| Farhat Leo | $42,100 | -- | |
| Hudson Joseph T | $71,200 | -- |
Source: Public Records
Tax History Compared to Growth
Tax History
| Year | Tax Paid | Tax Assessment Tax Assessment Total Assessment is a certain percentage of the fair market value that is determined by local assessors to be the total taxable value of land and additions on the property. | Land | Improvement |
|---|---|---|---|---|
| 2025 | $2,228 | $59,400 | $6,600 | $52,800 |
| 2024 | $17 | $56,600 | $6,600 | $50,000 |
| 2023 | $2,091 | $46,700 | $6,600 | $40,100 |
| 2022 | $1,887 | $42,400 | $5,200 | $37,200 |
| 2021 | $1,848 | $38,400 | $7,400 | $31,000 |
| 2020 | $1,837 | $36,100 | $7,400 | $28,700 |
| 2019 | $3,583 | $34,900 | $7,400 | $27,500 |
| 2018 | $2,149 | $31,100 | $7,400 | $23,700 |
| 2017 | $2,069 | $31,100 | $7,400 | $23,700 |
| 2016 | $3,693 | $28,500 | $7,400 | $21,100 |
| 2015 | $3,693 | $27,400 | $14,896 | $12,504 |
| 2014 | $3,693 | $26,300 | $15,000 | $11,300 |
Source: Public Records
Map
Nearby Homes
- 1128 W Washtenaw St
- 1128 W Michigan Ave
- 1232 W Michigan Ave
- 1234 W Allegan St
- 312 N Butler Blvd
- 1128 W Lenawee St
- 1140 W Lenawee St
- 914 W Hillsdale St
- 1319 W Michigan Ave
- 325 N Sycamore St
- 201 S Jenison Ave
- 416 N Martin Luther King Junior Blvd
- 418 N Martin Luther King Junior Blvd
- 425/425.5 N Butler Blvd
- 422 N Martin Luther King Junior Blvd
- 427 N Butler Blvd
- 1309 W Lenawee St
- 433 N Butler Blvd
- 1017 W Genesee St
- 411 W Ionia St
- 206 S Butler Blvd
- 210 S Butler Blvd
- 913 W Allegan St
- 212 S Butler Blvd
- 915 W Allegan St
- 216 S Butler Blvd
- 917 W Allegan St
- 921 W Allegan St
- 923 W Allegan St
- 226 S Butler Blvd
- 927 W Allegan St
- 228 S Butler Blvd
- 1007 W Allegan St
- 322 S Butler Blvd
- 200 S M l King jr Blvd
- 216 S Mlk Blvd
- 216 S Martin Luther King Junior Blvd
- 216 Martin Luther
- 200 S Martin Luther King Junior Blvd
- 222 S Mlk Blvd