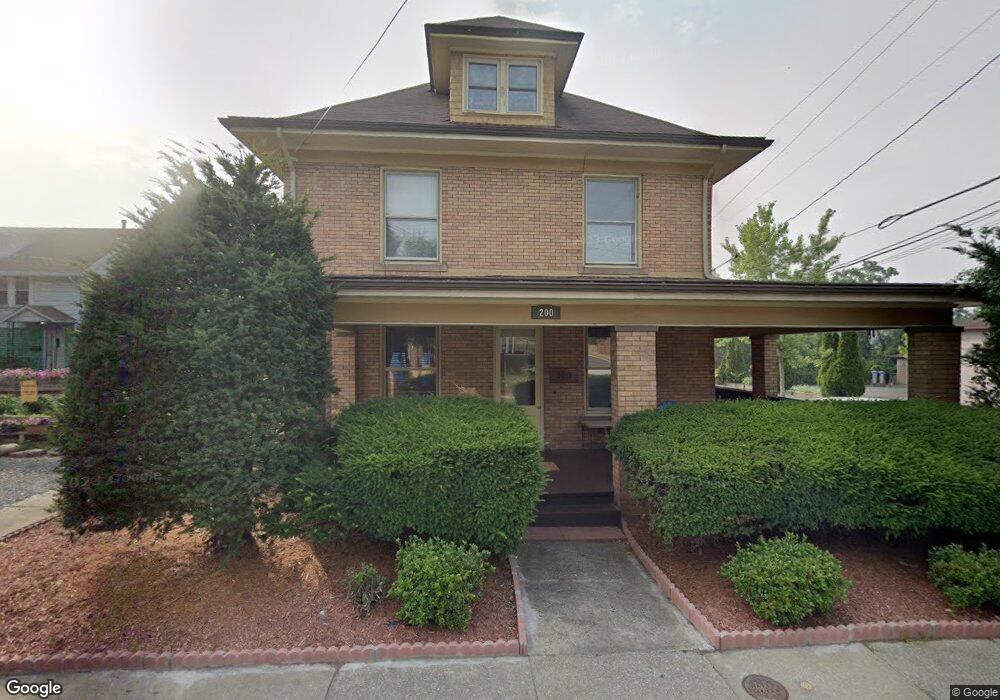
200 S High St Morgantown, WV 26501
South Park NeighborhoodEstimated Value: $286,000 - $334,000
4
Beds
2
Baths
2,150
Sq Ft
$143/Sq Ft
Est. Value
About This Home
This home is located at 200 S High St, Morgantown, WV 26501 and is currently estimated at $307,326, approximately $142 per square foot. 200 S High St is a home located in Monongalia County with nearby schools including Mountainview Elementary School, South Middle School, and Morgantown High School.
Ownership History
Date
Name
Owned For
Owner Type
Purchase Details
Closed on
May 26, 2014
Sold by
Bacho John Mark
Bought by
Bayo Tamba E M
Current Estimated Value
Purchase Details
Closed on
Apr 24, 2013
Sold by
Brazaitis Mark and Penn Juliet
Bought by
Bacho John Mark
Home Financials for this Owner
Home Financials are based on the most recent Mortgage that was taken out on this home.
Original Mortgage
$138,000
Interest Rate
3.45%
Mortgage Type
New Conventional
Create a Home Valuation Report for This Property
The Home Valuation Report is an in-depth analysis detailing your home's value as well as a comparison with similar homes in the area
Home Values in the Area
Average Home Value in this Area
Purchase History
| Date | Buyer | Sale Price | Title Company |
|---|---|---|---|
| Bayo Tamba E M | $205,500 | None Available | |
| Bacho John Mark | $172,500 | None Available |
Source: Public Records
Mortgage History
| Date | Status | Borrower | Loan Amount |
|---|---|---|---|
| Previous Owner | Bacho John Mark | $138,000 |
Source: Public Records
Tax History Compared to Growth
Tax History
| Year | Tax Paid | Tax Assessment Tax Assessment Total Assessment is a certain percentage of the fair market value that is determined by local assessors to be the total taxable value of land and additions on the property. | Land | Improvement |
|---|---|---|---|---|
| 2025 | $1,425 | $128,100 | $35,280 | $92,820 |
| 2024 | $1,425 | $128,100 | $35,280 | $92,820 |
| 2023 | $1,690 | $128,100 | $35,280 | $92,820 |
| 2022 | $1,611 | $126,360 | $35,220 | $91,140 |
| 2021 | $1,617 | $126,360 | $35,220 | $91,140 |
| 2020 | $1,531 | $119,160 | $35,220 | $83,940 |
| 2019 | $1,539 | $119,160 | $35,220 | $83,940 |
| 2018 | $1,543 | $119,160 | $35,220 | $83,940 |
| 2017 | $1,505 | $115,740 | $33,240 | $82,500 |
| 2016 | $1,475 | $112,860 | $30,360 | $82,500 |
| 2015 | $1,389 | $110,160 | $27,660 | $82,500 |
| 2014 | $1,288 | $106,080 | $24,720 | $81,360 |
Source: Public Records
Map
Nearby Homes
- 202 S High St Unit 204
- 210 S High St
- 132 Simpson St Unit 2
- 132 Simpson St
- 212 S High St
- 206 S High St
- 201 S High St
- 128 Simpson St
- 205 S High St
- 126 Simpson St Unit 1
- 126 Simpson St
- 145 S High St
- 124 Simpson St
- 221 S High St
- 204 Wagner Rd
- 225 S High St
- 208 Wagner Rd
- 150 Wagner Rd
- 200 Wagner Rd
- 142 Wagner Rd