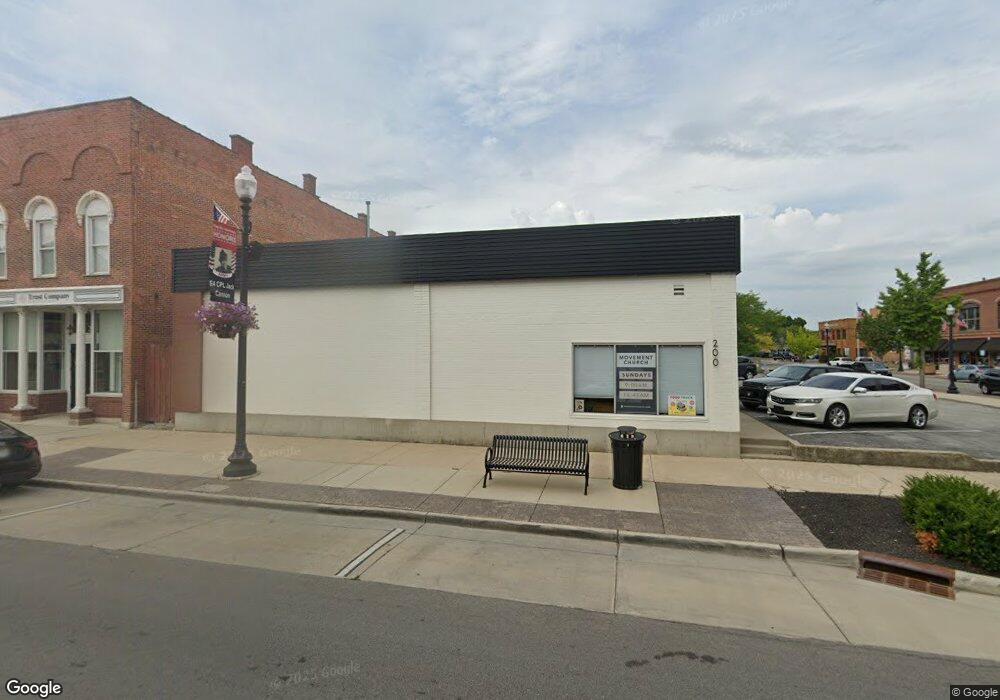
200 S Main St Findlay, OH 45840
Estimated Value: $559,762
Studio
--
Bath
7,500
Sq Ft
$75/Sq Ft
Est. Value
About This Home
This home is located at 200 S Main St, Findlay, OH 45840 and is currently estimated at $559,762, approximately $74 per square foot. 200 S Main St is a home located in Hancock County with nearby schools including Lincoln Elementary School, Donnell Middle School, and Findlay High School.
Ownership History
Date
Name
Owned For
Owner Type
Purchase Details
Closed on
Jan 2, 2020
Sold by
Brown James B and Brown Mary A
Bought by
Findlay Movement Church and Movement Church Findlay Inc
Current Estimated Value
Home Financials for this Owner
Home Financials are based on the most recent Mortgage that was taken out on this home.
Original Mortgage
$313,600
Interest Rate
3.6%
Mortgage Type
Commercial
Purchase Details
Closed on
Feb 17, 1994
Bought by
Brown James B and Brown Mary A
Purchase Details
Closed on
Jul 6, 1993
Bought by
B P Exploration & Oil Co
Purchase Details
Closed on
Nov 27, 1989
Bought by
Service Stations Holdings
Create a Home Valuation Report for This Property
The Home Valuation Report is an in-depth analysis detailing your home's value as well as a comparison with similar homes in the area
Home Values in the Area
Average Home Value in this Area
Purchase History
| Date | Buyer | Sale Price | Title Company |
|---|---|---|---|
| Findlay Movement Church | $392,000 | Flag City Title Agency Inc | |
| Brown James B | -- | -- | |
| B P Exploration & Oil Co | -- | -- | |
| Service Stations Holdings | $150,000 | -- |
Source: Public Records
Mortgage History
| Date | Status | Borrower | Loan Amount |
|---|---|---|---|
| Closed | Findlay Movement Church | $313,600 |
Source: Public Records
Tax History
| Year | Tax Paid | Tax Assessment Tax Assessment Total Assessment is a certain percentage of the fair market value that is determined by local assessors to be the total taxable value of land and additions on the property. | Land | Improvement |
|---|---|---|---|---|
| 2024 | -- | $190,750 | $43,750 | $147,000 |
| 2023 | $0 | $190,750 | $43,750 | $147,000 |
| 2022 | $388 | $190,750 | $43,750 | $147,000 |
| 2021 | $388 | $166,250 | $11,900 | $154,350 |
| 2020 | $10,714 | $165,830 | $35,000 | $130,830 |
| 2019 | $11,162 | $165,830 | $35,000 | $130,830 |
| 2018 | $10,874 | $165,830 | $35,000 | $130,830 |
| 2017 | $11,329 | $165,830 | $35,000 | $130,830 |
| 2016 | $11,332 | $165,830 | $35,000 | $130,830 |
| 2015 | $8,389 | $122,690 | $30,420 | $92,270 |
| 2014 | $8,417 | $122,690 | $30,420 | $92,270 |
| 2012 | $8,454 | $122,690 | $30,420 | $92,270 |
Source: Public Records
Map
Nearby Homes
- 212 S Main St
- 214 S Main St Unit Rear
- 214 S Main St
- 114 S Main St
- 106 W Front St Unit Suite A
- 108 W Front St
- 106 W Front St
- 116 S Main St
- 116 S Main St
- 116 W Front St
- 116 W Front St Unit A
- 110 S Main St
- 222 S Main St Unit 2
- 222 S Main St
- 108 S Main St
- 221 S Main St
- 209 S Main St
- 219 S Main St
- 104 S Main St
- 227 S Main St
Your Personal Tour Guide
Ask me questions while you tour the home.