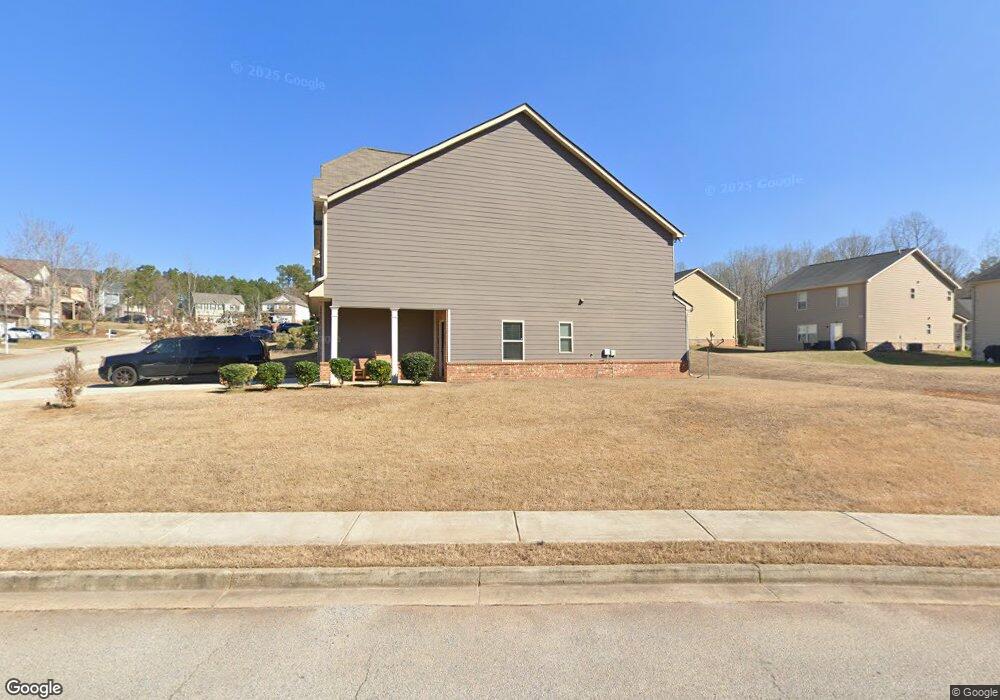
200 Sableshire Way Unit 731 Locust Grove, GA 30248
Estimated Value: $274,000 - $294,000
4
Beds
3
Baths
1,687
Sq Ft
$166/Sq Ft
Est. Value
About This Home
This home is located at 200 Sableshire Way Unit 731, Locust Grove, GA 30248 and is currently estimated at $280,235, approximately $166 per square foot. 200 Sableshire Way Unit 731 is a home located in Henry County with nearby schools including Locust Grove Elementary School, Locust Grove Middle School, and Locust Grove High School.
Ownership History
Date
Name
Owned For
Owner Type
Purchase Details
Closed on
Dec 19, 2024
Sold by
Diversified Residential Homes 1 Llc
Bought by
Prnl Residential Buyer Llc
Current Estimated Value
Purchase Details
Closed on
Dec 11, 2024
Sold by
Computershare Trust Co National Associat
Bought by
Diversified Residential Homes 1 Llc
Purchase Details
Closed on
Jan 13, 2021
Sold by
Vsp Atlanta Llc
Bought by
Diversified Residential Homes 1 Llc
Purchase Details
Closed on
Dec 20, 2019
Sold by
Resibuilt Homes Llc
Bought by
Vsp Atlanta Llc
Purchase Details
Closed on
Jun 18, 2019
Sold by
Barnett Land And Cattle Co Llc
Bought by
Resibuilt Homes Llc
Purchase Details
Closed on
Nov 15, 2012
Sold by
Bartram David L
Bought by
First Five Of All Five Llc
Purchase Details
Closed on
Jun 22, 2011
Sold by
Southern Cmnty Bk
Bought by
Bartram David L
Purchase Details
Closed on
Oct 6, 2009
Sold by
Edson Homes Llc
Bought by
United Cmnty Bk
Create a Home Valuation Report for This Property
The Home Valuation Report is an in-depth analysis detailing your home's value as well as a comparison with similar homes in the area
Home Values in the Area
Average Home Value in this Area
Purchase History
| Date | Buyer | Sale Price | Title Company |
|---|---|---|---|
| Prnl Residential Buyer Llc | $275,000 | -- | |
| Diversified Residential Homes 1 Llc | -- | -- | |
| Diversified Residential Homes 1 Llc | $2,181,328 | -- | |
| Vsp Atlanta Llc | $190,970 | -- | |
| Resibuilt Homes Llc | -- | -- | |
| Barnett Land And Cattle Co Llc | -- | -- | |
| First Five Of All Five Llc | -- | -- | |
| Bartram David L | $7,200 | -- | |
| United Cmnty Bk | $395,640 | -- |
Source: Public Records
Tax History Compared to Growth
Tax History
| Year | Tax Paid | Tax Assessment Tax Assessment Total Assessment is a certain percentage of the fair market value that is determined by local assessors to be the total taxable value of land and additions on the property. | Land | Improvement |
|---|---|---|---|---|
| 2025 | $4,126 | $105,840 | $16,000 | $89,840 |
| 2024 | $4,126 | $122,560 | $16,000 | $106,560 |
| 2023 | $4,453 | $122,960 | $16,000 | $106,960 |
| 2022 | $3,283 | $89,800 | $16,000 | $73,800 |
| 2021 | $2,690 | $73,240 | $16,000 | $57,240 |
| 2020 | $2,633 | $71,680 | $13,000 | $58,680 |
| 2019 | $442 | $12,000 | $12,000 | $0 |
| 2018 | $336 | $9,200 | $9,200 | $0 |
| 2016 | $283 | $7,760 | $7,760 | $0 |
| 2015 | $190 | $5,040 | $5,040 | $0 |
| 2014 | $100 | $2,640 | $2,640 | $0 |
Source: Public Records
Map
Nearby Homes
- 380 Higgins Rd
- 198 Aster Ave
- 194 Aster Ave
- 501 Vervain Dr
- 501 Kirkland Dr
- 190 Aster Ave
- 505 Kirkland Dr
- 191 Aster Ave
- 186 Aster Ave
- 505 Vervain Dr
- 608 Lobelia Dr
- 182 Aster Ave
- 178 Aster Ave
- 269 Baumgard Way
- 188 Sophie Cir
- 150 Aster Ave
- Cali Plan at Cedar Ridge - Locust Grove Station
- Belfort Plan at Cedar Ridge - Locust Grove Station
- Galen Plan at Cedar Ridge - Locust Grove Station
- Hayden Plan at Cedar Ridge - Locust Grove Station
- 200 Sableshire Way
- 204 Sableshire Way Unit 732
- 204 Sableshire Way
- 208 Sableshire Way Unit 733
- 208 Sableshire Way
- 208 Sableshire Way
- 305 Nutwood Trace
- 309 Nutwood Trace
- 313 Nutwood Trace
- 301 Nutwood Trace
- 117 Avonwood Cir
- 0 Sableshire Way Unit 8718935
- 0 Sableshire Way Unit 8655014
- 0 Sableshire Way Unit 8571024
- 0 Sableshire Way Unit 3222340
- 0 Sableshire Way Unit 7152025
- 0 Sableshire Way Unit 3238096
- 0 Sableshire Way Unit 3238095
- 0 Sableshire Way Unit 3238085
- 0 Sableshire Way Unit 3238094