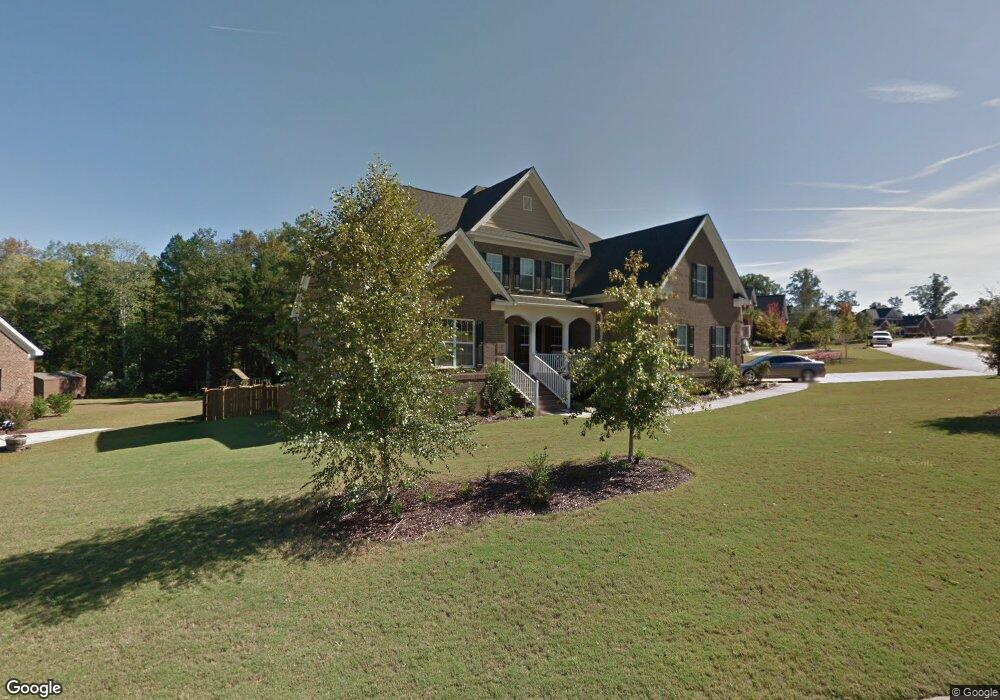
200 Scarlet Oak Way Lexington, SC 29072
Estimated Value: $612,000 - $725,000
5
Beds
4
Baths
4,151
Sq Ft
$162/Sq Ft
Est. Value
About This Home
This home is located at 200 Scarlet Oak Way, Lexington, SC 29072 and is currently estimated at $673,198, approximately $162 per square foot. 200 Scarlet Oak Way is a home located in Lexington County with nearby schools including Meadow Glen Elementary, Meadow Glen Middle School, and River Bluff High School.
Ownership History
Date
Name
Owned For
Owner Type
Purchase Details
Closed on
Jun 28, 2021
Sold by
Clardy Julia G and Clardy Tab J
Bought by
Blevins John and Blevins Crystal
Current Estimated Value
Home Financials for this Owner
Home Financials are based on the most recent Mortgage that was taken out on this home.
Original Mortgage
$293,000
Outstanding Balance
$265,852
Interest Rate
2.9%
Mortgage Type
New Conventional
Estimated Equity
$407,346
Purchase Details
Closed on
Apr 25, 2012
Sold by
Essex Homes Southeast Inc
Bought by
Clardy Tab J and Clardy Julia G
Home Financials for this Owner
Home Financials are based on the most recent Mortgage that was taken out on this home.
Original Mortgage
$373,573
Interest Rate
4.13%
Mortgage Type
Future Advance Clause Open End Mortgage
Purchase Details
Closed on
Feb 20, 2007
Sold by
The Atlantis Development Group Llc
Bought by
Essex Homes Southeast Inc
Create a Home Valuation Report for This Property
The Home Valuation Report is an in-depth analysis detailing your home's value as well as a comparison with similar homes in the area
Home Values in the Area
Average Home Value in this Area
Purchase History
| Date | Buyer | Sale Price | Title Company |
|---|---|---|---|
| Blevins John | $533,000 | None Available | |
| Clardy Tab J | $393,234 | -- | |
| Essex Homes Southeast Inc | $472,000 | None Available | |
| The Atlantis Development Group Llc | $204,700 | None Available |
Source: Public Records
Mortgage History
| Date | Status | Borrower | Loan Amount |
|---|---|---|---|
| Open | Blevins John | $293,000 | |
| Previous Owner | Clardy Tab J | $373,573 |
Source: Public Records
Tax History Compared to Growth
Tax History
| Year | Tax Paid | Tax Assessment Tax Assessment Total Assessment is a certain percentage of the fair market value that is determined by local assessors to be the total taxable value of land and additions on the property. | Land | Improvement |
|---|---|---|---|---|
| 2024 | $3,739 | $21,320 | $2,200 | $19,120 |
| 2023 | $3,739 | $21,320 | $2,200 | $19,120 |
| 2020 | $3,098 | $17,334 | $2,200 | $15,134 |
| 2019 | $2,867 | $15,110 | $1,600 | $13,510 |
| 2018 | $2,824 | $15,110 | $1,600 | $13,510 |
| 2017 | $2,755 | $15,110 | $1,600 | $13,510 |
| 2016 | $2,734 | $15,109 | $1,600 | $13,509 |
| 2014 | $2,757 | $15,719 | $2,000 | $13,719 |
| 2013 | -- | $15,720 | $2,000 | $13,720 |
Source: Public Records
Map
Nearby Homes
- 108 Black Walnut Dr
- 220 Scarlet Oak Way
- 109 Red Ash Ln
- 116 Tolbert St
- 213 Beckenham St
- 132 Herrick Ct
- 228 Ashmore Ln
- 160 Woodside Rd
- 112 Kenzi Ct
- 4901 Sunset Blvd Unit 303
- 124 Woodside Rd
- 0 Mineral Springs Rd Unit 560120
- 0 Roper Mountain Ct Unit 613841
- 111 Crepe Myrtle Cir
- 291 Big Timber Dr
- 152 Shoal Ct
- 100 Berrybrook Ln
- 124 Park Place Ct
- 129 River Bridge Ln
- 1012 Mineral Creek Ct
- 204 Scarlet Oak Way
- 100 Black Walnut Dr
- 107 Black Walnut Dr
- 107 Black Walnut Dr Unit 56
- 201 Scarlet Oak Way
- 205 Scarlet Oak Way
- 104 Black Walnut Dr
- 208 Scarlet Oak Way
- 137 Scarlet Oak Way
- 209 Scarlet Oak Way
- 212 Scarlet Oak Way
- 109 Black Walnut Dr
- 132 Scarlet Oak Way
- 213 Scarlet Oak Way
- 133 Scarlet Oak Way
- 105 Arrowwood Ct
- 112 Black Walnut Dr
- 113 Black Walnut Dr
- 128 Scarlet Oak Way
- 129 Scarlet Oak Way