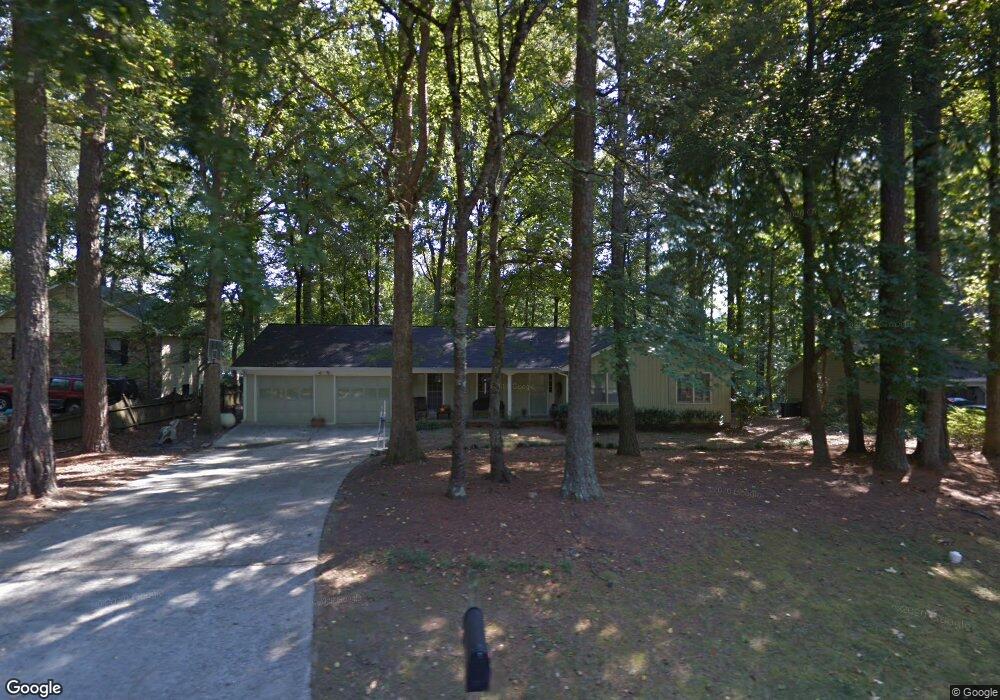
200 Shady Grove Ln Alpharetta, GA 30009
Estimated Value: $794,834 - $1,268,000
3
Beds
2
Baths
1,591
Sq Ft
$630/Sq Ft
Est. Value
About This Home
This home is located at 200 Shady Grove Ln, Alpharetta, GA 30009 and is currently estimated at $1,001,709, approximately $629 per square foot. 200 Shady Grove Ln is a home located in Fulton County with nearby schools including Alpharetta Elementary School, Hopewell Middle School, and Cambridge High School.
Ownership History
Date
Name
Owned For
Owner Type
Purchase Details
Closed on
Jun 3, 2008
Sold by
Deadwyler Stephen H and Deadwyler Mary C
Bought by
Deadwyler Stephen H
Current Estimated Value
Purchase Details
Closed on
Aug 15, 2000
Sold by
Autry Family Tu
Bought by
Deadwyler Stephen H and Deadwyler Mary C
Home Financials for this Owner
Home Financials are based on the most recent Mortgage that was taken out on this home.
Original Mortgage
$80,000
Interest Rate
8.24%
Mortgage Type
New Conventional
Purchase Details
Closed on
Jun 27, 2000
Sold by
Autry Susan D
Bought by
Deadwyler Stephen H and Deadwyler Mary C
Home Financials for this Owner
Home Financials are based on the most recent Mortgage that was taken out on this home.
Original Mortgage
$80,000
Interest Rate
8.24%
Mortgage Type
New Conventional
Purchase Details
Closed on
Sep 21, 1999
Sold by
Autry Harlow and Autry Roy H
Bought by
Autry Family Trust
Create a Home Valuation Report for This Property
The Home Valuation Report is an in-depth analysis detailing your home's value as well as a comparison with similar homes in the area
Home Values in the Area
Average Home Value in this Area
Purchase History
| Date | Buyer | Sale Price | Title Company |
|---|---|---|---|
| Deadwyler Stephen H | -- | -- | |
| Deadwyler Stephen H | $60,000 | -- | |
| Deadwyler Stephen H | $60,000 | -- | |
| Deadwyler Stephen H | -- | -- | |
| Autry Family Trust | -- | -- |
Source: Public Records
Mortgage History
| Date | Status | Borrower | Loan Amount |
|---|---|---|---|
| Previous Owner | Deadwyler Stephen H | $80,000 | |
| Previous Owner | Deadwyler Stephen H | $80,000 |
Source: Public Records
Tax History Compared to Growth
Tax History
| Year | Tax Paid | Tax Assessment Tax Assessment Total Assessment is a certain percentage of the fair market value that is determined by local assessors to be the total taxable value of land and additions on the property. | Land | Improvement |
|---|---|---|---|---|
| 2025 | $1,218 | $297,840 | $92,160 | $205,680 |
| 2023 | $1,218 | $201,800 | $57,240 | $144,560 |
| 2022 | $4,399 | $167,200 | $36,160 | $131,040 |
| 2021 | $4,055 | $123,320 | $30,880 | $92,440 |
| 2020 | $3,863 | $115,160 | $36,200 | $78,960 |
| 2019 | $668 | $116,120 | $21,320 | $94,800 |
| 2018 | $3,201 | $113,400 | $20,840 | $92,560 |
| 2017 | $2,366 | $81,080 | $24,360 | $56,720 |
| 2016 | $2,366 | $81,080 | $24,360 | $56,720 |
| 2015 | $1,866 | $81,080 | $24,360 | $56,720 |
| 2014 | $1,632 | $53,240 | $16,000 | $37,240 |
Source: Public Records
Map
Nearby Homes
- 190 Shady Grove Ln
- 210 Shady Grove Ln
- 183 Jere Dr
- 180 Shady Grove Ln
- 220 Shady Grove Ln
- 326 Hook St
- 203 Jere Dr
- 215 Shady Grove Ln
- 205 Shady Grove Ln
- 225 Shady Grove Ln Unit 33
- 225 Shady Grove Ln
- 320 Hook St
- 0 Shady Grove Ln Unit 7360148
- 0 Shady Grove Ln Unit 7294945
- 0 Shady Grove Ln Unit 7258298
- 0 Shady Grove Ln Unit 7225254
- 0 Shady Grove Ln Unit 8728703
- 0 Shady Grove Ln Unit 8433242
- 0 Shady Grove Ln Unit 8159919
- 0 Shady Grove Ln Unit 7590890