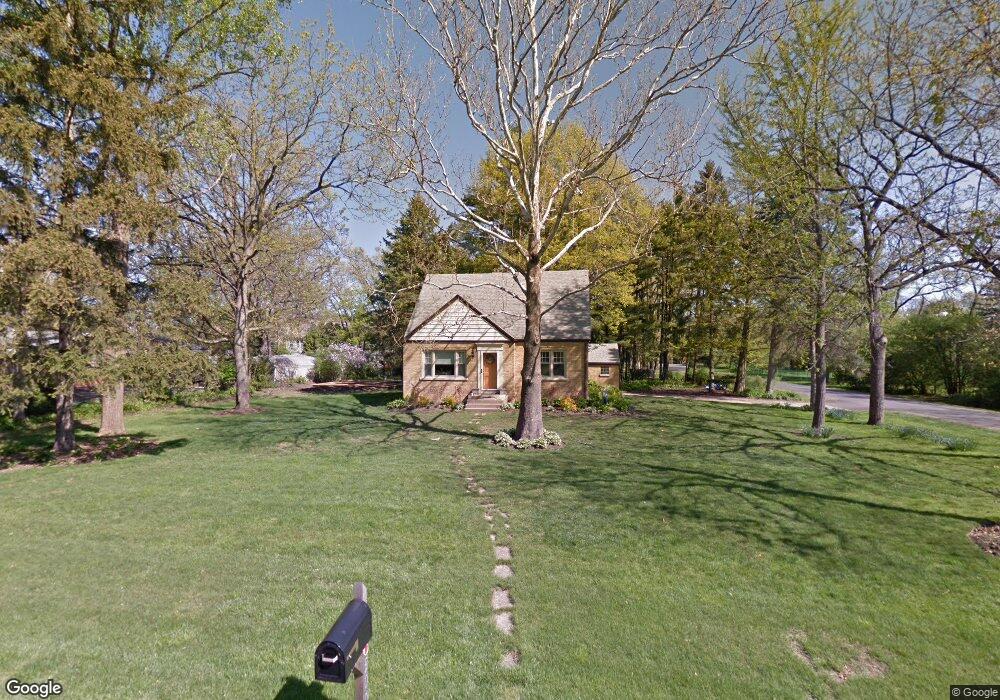
200 South Pkwy Prospect Heights, IL 60070
Estimated Value: $472,000 - $704,909
3
Beds
2
Baths
3,617
Sq Ft
$162/Sq Ft
Est. Value
About This Home
This home is located at 200 South Pkwy, Prospect Heights, IL 60070 and is currently estimated at $584,727, approximately $161 per square foot. 200 South Pkwy is a home located in Cook County with nearby schools including Dwight D Eisenhower Elementary School, Anne Sullivan Elementary School, and Betsy Ross Elementary School.
Ownership History
Date
Name
Owned For
Owner Type
Purchase Details
Closed on
Jun 17, 2020
Sold by
Hammer Ryan P and Hammer Emily A
Bought by
Hammer Ryan P and Hammer Emily A
Current Estimated Value
Purchase Details
Closed on
Jul 20, 2010
Sold by
Dvoratchek Jeanine and Dvoratchek Emily
Bought by
Hammer Ryan P and Hammer Emily A
Home Financials for this Owner
Home Financials are based on the most recent Mortgage that was taken out on this home.
Original Mortgage
$225,000
Interest Rate
4.36%
Mortgage Type
New Conventional
Purchase Details
Closed on
Mar 30, 2009
Sold by
Dvoratchek James
Bought by
Dvoratchek Jeanine and Dvoratchek Emily
Purchase Details
Closed on
Oct 14, 2008
Sold by
Schulze Meredith Linda A
Bought by
Dvoratchek Emily and Dvoratchek Jeanine
Home Financials for this Owner
Home Financials are based on the most recent Mortgage that was taken out on this home.
Original Mortgage
$226,800
Interest Rate
5.73%
Mortgage Type
Purchase Money Mortgage
Create a Home Valuation Report for This Property
The Home Valuation Report is an in-depth analysis detailing your home's value as well as a comparison with similar homes in the area
Home Values in the Area
Average Home Value in this Area
Purchase History
| Date | Buyer | Sale Price | Title Company |
|---|---|---|---|
| Hammer Ryan P | -- | None Available | |
| Hammer Ryan P | -- | Executive Land Title | |
| Dvoratchek Jeanine | -- | None Available | |
| Dvoratchek Emily | $283,500 | Attorneys Title Guaranty Fun |
Source: Public Records
Mortgage History
| Date | Status | Borrower | Loan Amount |
|---|---|---|---|
| Previous Owner | Hammer Ryan P | $225,000 | |
| Previous Owner | Dvoratchek Emily | $226,800 |
Source: Public Records
Tax History Compared to Growth
Tax History
| Year | Tax Paid | Tax Assessment Tax Assessment Total Assessment is a certain percentage of the fair market value that is determined by local assessors to be the total taxable value of land and additions on the property. | Land | Improvement |
|---|---|---|---|---|
| 2024 | $15,534 | $55,000 | $9,122 | $45,878 |
| 2023 | $14,534 | $55,000 | $9,122 | $45,878 |
| 2022 | $14,534 | $55,000 | $9,122 | $45,878 |
| 2021 | $9,405 | $32,014 | $7,981 | $24,033 |
| 2020 | $9,181 | $32,014 | $7,981 | $24,033 |
| 2019 | $9,110 | $35,571 | $7,981 | $27,590 |
| 2018 | $11,256 | $39,845 | $6,841 | $33,004 |
| 2017 | $11,147 | $39,845 | $6,841 | $33,004 |
| 2016 | $7,420 | $28,576 | $6,841 | $21,735 |
| 2015 | $5,496 | $20,115 | $5,701 | $14,414 |
| 2014 | $5,455 | $20,115 | $5,701 | $14,414 |
| 2013 | $5,302 | $20,115 | $5,701 | $14,414 |
Source: Public Records
Map
Nearby Homes
- 13 W Kenilworth Ave
- 11 W Palatine Rd
- 505 N Maple St
- 412 W Olive Ave
- 307 Anne Ct
- 2611 E Radford Ct
- 1912 N Coldspring Rd Unit 96
- 1949 N Charter Point Dr Unit 1949
- 300 E Marion Ave
- 107 W Brighton Place Unit T12
- 2420 E Brandenberry Ct Unit 4C
- 211 W Hanover Place Unit T85
- 2424 E Oakton St Unit 3C
- 2060 N Charter Point Dr Unit 14
- 1956 N Lake Arlington Dr
- 2315 E Olive St Unit 3G
- 2315 E Olive St Unit 2G
- 1525 Sander Ct Unit 103
- 1500 Sandstone Dr Unit 307
- 2431 E Brandenberry Ct Unit 2O