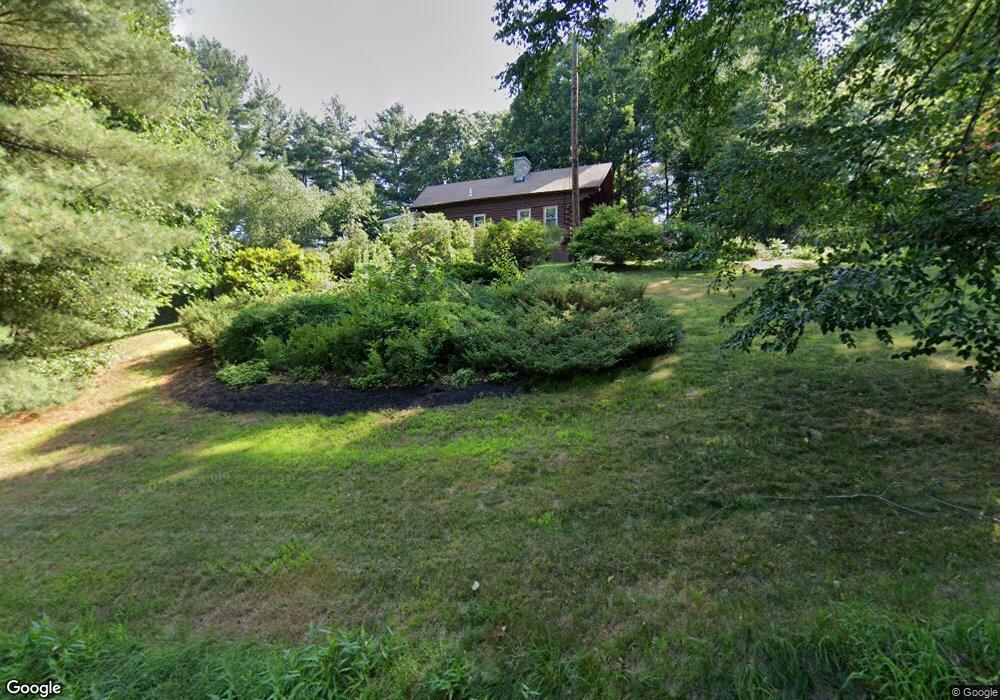
200 Spring St Ashland, MA 01721
Estimated Value: $435,000 - $665,000
1
Bed
1
Bath
1,152
Sq Ft
$458/Sq Ft
Est. Value
About This Home
This home is located at 200 Spring St, Ashland, MA 01721 and is currently estimated at $527,183, approximately $457 per square foot. 200 Spring St is a home located in Middlesex County with nearby schools including William Pittaway Elementary School, Henry E. Warren Elementary School, and David Mindess Elementary School.
Ownership History
Date
Name
Owned For
Owner Type
Purchase Details
Closed on
Jun 28, 2002
Sold by
Beatty Eleanor M
Bought by
Cabassa Heather D
Current Estimated Value
Home Financials for this Owner
Home Financials are based on the most recent Mortgage that was taken out on this home.
Original Mortgage
$216,000
Outstanding Balance
$92,929
Interest Rate
6.92%
Mortgage Type
Purchase Money Mortgage
Estimated Equity
$434,254
Create a Home Valuation Report for This Property
The Home Valuation Report is an in-depth analysis detailing your home's value as well as a comparison with similar homes in the area
Home Values in the Area
Average Home Value in this Area
Purchase History
| Date | Buyer | Sale Price | Title Company |
|---|---|---|---|
| Cabassa Heather D | $279,900 | -- |
Source: Public Records
Mortgage History
| Date | Status | Borrower | Loan Amount |
|---|---|---|---|
| Open | Cabassa Heather D | $216,000 |
Source: Public Records
Tax History
| Year | Tax Paid | Tax Assessment Tax Assessment Total Assessment is a certain percentage of the fair market value that is determined by local assessors to be the total taxable value of land and additions on the property. | Land | Improvement |
|---|---|---|---|---|
| 2025 | $6,110 | $478,500 | $268,500 | $210,000 |
| 2024 | $6,006 | $453,600 | $268,500 | $185,100 |
| 2023 | $5,582 | $405,400 | $255,900 | $149,500 |
| 2022 | $5,745 | $361,800 | $232,400 | $129,400 |
| 2021 | $5,423 | $340,400 | $232,400 | $108,000 |
| 2020 | $5,236 | $324,000 | $232,400 | $91,600 |
| 2019 | $5,104 | $313,500 | $232,400 | $81,100 |
| 2018 | $14,315 | $305,800 | $230,100 | $75,700 |
| 2017 | $3,964 | $301,500 | $230,100 | $71,400 |
| 2016 | $4,933 | $290,200 | $227,100 | $63,100 |
| 2015 | $4,751 | $274,600 | $214,200 | $60,400 |
| 2014 | $4,452 | $256,000 | $190,200 | $65,800 |
Source: Public Records
Map
Nearby Homes
- 128 Clinton St
- 15 Haven Way
- 33 Garett Way Unit 33
- 37 Garett Way Unit 37
- 9 Olive St
- 54 Garett Way Unit 54
- 19 Crispwater Way Unit 178
- 147 N Mill St
- 207 Eliot St
- 9 Mountain Gate Rd
- 74 Meeting House Path
- 10 Metropolitan Ave
- 26 Meeting House Path Unit 26
- 147 Turner Rd Unit 80
- 62 Ashland St
- 22 Wilbur Dr
- 257-259 Main St
- 20 Braeburn Ln
- 0 Ballard Highland Marietta Unit 73391306
- 102 Captain Eames Cir
Your Personal Tour Guide
Ask me questions while you tour the home.