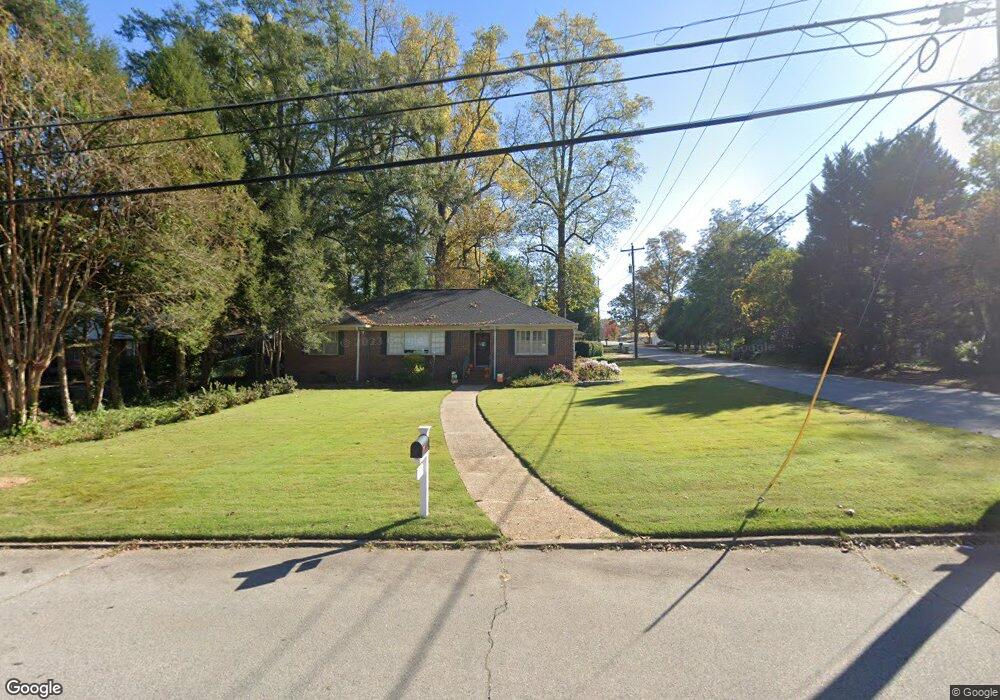
200 Springdale Dr Lagrange, GA 30240
Estimated Value: $294,852 - $345,000
3
Beds
2
Baths
2,183
Sq Ft
$147/Sq Ft
Est. Value
About This Home
This home is located at 200 Springdale Dr, Lagrange, GA 30240 and is currently estimated at $320,213, approximately $146 per square foot. 200 Springdale Dr is a home located in Troup County with nearby schools including Hollis Hand Elementary School, Ethel W. Kight Elementary School, and Franklin Forest Elementary School.
Ownership History
Date
Name
Owned For
Owner Type
Purchase Details
Closed on
Sep 27, 2019
Sold by
Napier Matthew J
Bought by
Hardage Todd Kevin and Hardage Teresa Watkins
Current Estimated Value
Home Financials for this Owner
Home Financials are based on the most recent Mortgage that was taken out on this home.
Original Mortgage
$189,012
Outstanding Balance
$164,903
Interest Rate
3.62%
Mortgage Type
FHA
Estimated Equity
$155,310
Purchase Details
Closed on
May 31, 2005
Sold by
Hetzel Russell Z
Bought by
Napier Matthew J and Anderson Casi L
Home Financials for this Owner
Home Financials are based on the most recent Mortgage that was taken out on this home.
Original Mortgage
$144,000
Interest Rate
6%
Mortgage Type
New Conventional
Purchase Details
Closed on
Dec 16, 2002
Sold by
Struletz Allan and Struletz Howard
Bought by
Russell Hetzel and Russell Elizabeth
Purchase Details
Closed on
May 1, 1949
Sold by
Hunt W P
Bought by
Struletz Allan and Struletz Howard
Create a Home Valuation Report for This Property
The Home Valuation Report is an in-depth analysis detailing your home's value as well as a comparison with similar homes in the area
Purchase History
| Date | Buyer | Sale Price | Title Company |
|---|---|---|---|
| Hardage Todd Kevin | $192,500 | -- | |
| Napier Matthew J | $180,000 | -- | |
| Russell Hetzel | $164,000 | -- | |
| Struletz Allan | -- | -- |
Source: Public Records
Mortgage History
| Date | Status | Borrower | Loan Amount |
|---|---|---|---|
| Open | Hardage Todd Kevin | $189,012 | |
| Previous Owner | Napier Matthew J | $144,000 |
Source: Public Records
Tax History
| Year | Tax Paid | Tax Assessment Tax Assessment Total Assessment is a certain percentage of the fair market value that is determined by local assessors to be the total taxable value of land and additions on the property. | Land | Improvement |
|---|---|---|---|---|
| 2025 | $2,850 | $108,480 | $18,000 | $90,480 |
| 2024 | $2,750 | $102,840 | $18,000 | $84,840 |
| 2023 | $2,481 | $92,960 | $18,000 | $74,960 |
| 2022 | $2,264 | $83,120 | $14,000 | $69,120 |
| 2021 | $2,137 | $72,840 | $14,000 | $58,840 |
| 2020 | $2,137 | $72,840 | $14,000 | $58,840 |
| 2019 | $1,594 | $54,840 | $14,000 | $40,840 |
| 2018 | $1,594 | $54,840 | $14,000 | $40,840 |
| 2017 | $1,290 | $44,752 | $9,000 | $35,752 |
| 2016 | $1,274 | $44,222 | $9,000 | $35,222 |
| 2015 | $1,283 | $44,438 | $9,216 | $35,222 |
| 2014 | $1,263 | $43,712 | $9,216 | $34,496 |
| 2013 | -- | $47,761 | $9,272 | $38,489 |
Source: Public Records
Map
Nearby Homes
- 598 Edmondson Ave
- 203 Waverly Way
- 105 Saynor Cir
- 208 Boulevard
- 216 E Lane Cir
- 119 College Ave
- 120 Saynor Cir
- 206 Broad St
- 405 W Broome St Unit 2
- 405 W Broome St Unit 3
- 405 W Broome St Unit 4
- 405 W Broome St Unit 1
- 405 W Broome St Unit 5
- 304 Boulevard
- 416 Park Ave
- 421 College Ave
- 705 Piney Woods Dr
- 217 Jefferson St
- 505 S Lewis St
- 509 S Lewis St
- 201 Springdale Dr
- 203 Springdale Dr
- 1085 5 Springdale Dr
- 108 Springdale Dr
- 108 Springdale Dr Unit 5
- 108 Springdale Dr Unit Rear
- 108.5 Springdale Dr
- 199 Springdale Dr
- 204 Springdale Dr
- 602 W Haralson St
- 106 Springdale Dr
- 209 Springdale Dr
- 211 Springdale Dr
- 601 W Haralson St Unit 9
- 601 W Haralson St Unit 7
- 601 W Haralson St Unit 8
- 601 W Haralson St Unit 11
- 601 W Haralson St Unit 10
- 603 W Haralson St Unit 5
- 603 W Haralson St Unit 3
Your Personal Tour Guide
Ask me questions while you tour the home.