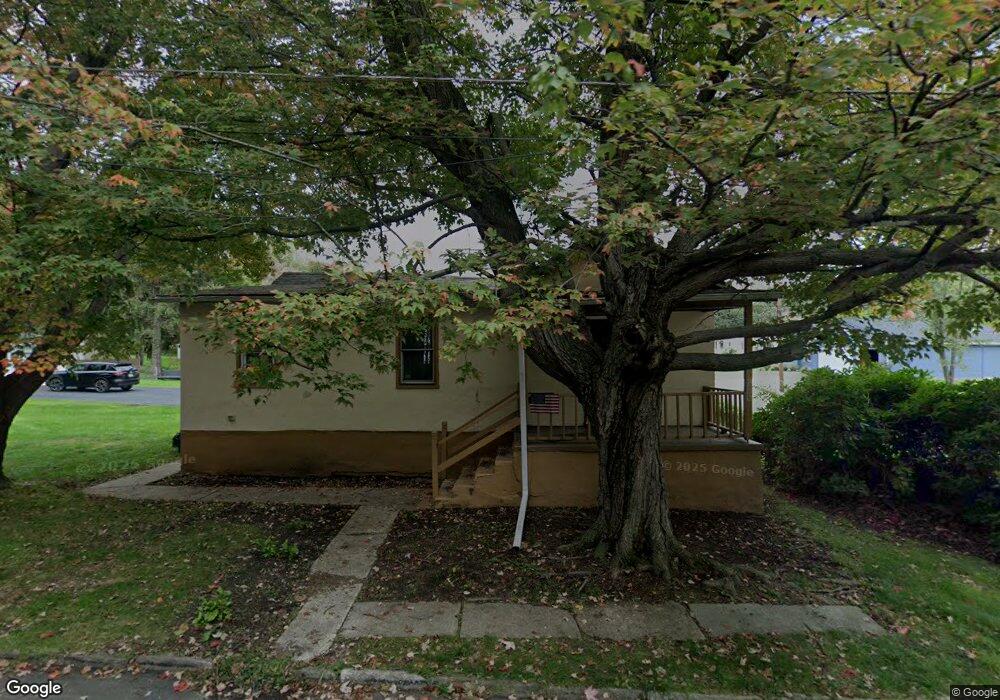
200 Stanton St Dupont, PA 18641
Estimated Value: $63,477 - $200,000
--
Bed
--
Bath
816
Sq Ft
$154/Sq Ft
Est. Value
About This Home
This home is located at 200 Stanton St, Dupont, PA 18641 and is currently estimated at $125,369, approximately $153 per square foot. 200 Stanton St is a home located in Luzerne County with nearby schools including Pittston City Intermediate Center, Pittston Area Middle School, and Frederick County Middle School.
Ownership History
Date
Name
Owned For
Owner Type
Purchase Details
Closed on
Sep 14, 2022
Sold by
Rolek Jr Frank S
Bought by
Campbell Robert
Current Estimated Value
Purchase Details
Closed on
Aug 5, 2022
Sold by
Bley Bekanich Yvonne M and Bley Richard
Bought by
Rolek Frank S
Purchase Details
Closed on
Mar 22, 2013
Sold by
Rolek Frank S
Bought by
Bekanick Yvonne M Bley
Create a Home Valuation Report for This Property
The Home Valuation Report is an in-depth analysis detailing your home's value as well as a comparison with similar homes in the area
Home Values in the Area
Average Home Value in this Area
Purchase History
| Date | Buyer | Sale Price | Title Company |
|---|---|---|---|
| Campbell Robert | $39,000 | -- | |
| Rolek Frank S | -- | None Listed On Document | |
| Bekanick Yvonne M Bley | -- | None Available |
Source: Public Records
Tax History Compared to Growth
Tax History
| Year | Tax Paid | Tax Assessment Tax Assessment Total Assessment is a certain percentage of the fair market value that is determined by local assessors to be the total taxable value of land and additions on the property. | Land | Improvement |
|---|---|---|---|---|
| 2025 | $1,265 | $51,400 | $21,600 | $29,800 |
| 2024 | $1,265 | $51,400 | $21,600 | $29,800 |
| 2023 | $1,266 | $51,400 | $21,600 | $29,800 |
| 2022 | $1,256 | $51,400 | $21,600 | $29,800 |
| 2021 | $1,256 | $51,400 | $21,600 | $29,800 |
| 2020 | $1,227 | $51,400 | $21,600 | $29,800 |
| 2019 | $1,217 | $51,400 | $21,600 | $29,800 |
| 2018 | $1,192 | $51,400 | $21,600 | $29,800 |
| 2017 | $1,140 | $51,400 | $21,600 | $29,800 |
| 2016 | -- | $51,400 | $21,600 | $29,800 |
| 2015 | -- | $51,400 | $21,600 | $29,800 |
| 2014 | -- | $51,400 | $21,600 | $29,800 |
Source: Public Records
Map
Nearby Homes