200 SW Florence Ave Unit D5 Gresham, OR 97080
Hollybrook NeighborhoodEstimated Value: $163,000 - $184,000
2
Beds
1
Bath
766
Sq Ft
$224/Sq Ft
Est. Value
About This Home
This home is located at 200 SW Florence Ave Unit D5, Gresham, OR 97080 and is currently estimated at $171,451, approximately $223 per square foot. 200 SW Florence Ave Unit D5 is a home located in Multnomah County with nearby schools including Dexter McCarty Middle School, Gresham High School, and Gresham Arthur Academy.
Ownership History
Date
Name
Owned For
Owner Type
Purchase Details
Closed on
Jan 12, 2017
Sold by
Vanhorn Anthony S
Bought by
Vanhorn Tammy S
Current Estimated Value
Home Financials for this Owner
Home Financials are based on the most recent Mortgage that was taken out on this home.
Original Mortgage
$71,000
Outstanding Balance
$58,300
Interest Rate
4.08%
Mortgage Type
New Conventional
Estimated Equity
$113,151
Purchase Details
Closed on
May 7, 2013
Sold by
Donald A Fancher Llc
Bought by
Vanhorn Anthony S and Van Horn Tammy S
Home Financials for this Owner
Home Financials are based on the most recent Mortgage that was taken out on this home.
Original Mortgage
$69,350
Interest Rate
3.54%
Mortgage Type
New Conventional
Purchase Details
Closed on
Oct 18, 2006
Sold by
Fancher Donald A
Bought by
Donald A Fancher Llc
Purchase Details
Closed on
May 13, 2005
Sold by
Fancher Phyllis R
Bought by
Fancher Donald A and The Donald A Fancher Trust
Create a Home Valuation Report for This Property
The Home Valuation Report is an in-depth analysis detailing your home's value as well as a comparison with similar homes in the area
Home Values in the Area
Average Home Value in this Area
Purchase History
| Date | Buyer | Sale Price | Title Company |
|---|---|---|---|
| Vanhorn Tammy S | -- | First American | |
| Vanhorn Anthony S | $73,000 | Lawyers Title | |
| Donald A Fancher Llc | -- | None Available | |
| Fancher Donald A | -- | -- |
Source: Public Records
Mortgage History
| Date | Status | Borrower | Loan Amount |
|---|---|---|---|
| Open | Vanhorn Tammy S | $71,000 | |
| Closed | Vanhorn Anthony S | $69,350 |
Source: Public Records
Tax History
| Year | Tax Paid | Tax Assessment Tax Assessment Total Assessment is a certain percentage of the fair market value that is determined by local assessors to be the total taxable value of land and additions on the property. | Land | Improvement |
|---|---|---|---|---|
| 2025 | $1,616 | $79,420 | -- | $79,420 |
| 2024 | $1,547 | $77,110 | -- | $77,110 |
| 2023 | $1,410 | $74,870 | $0 | $74,870 |
| 2022 | $1,370 | $72,690 | $0 | $0 |
| 2021 | $1,336 | $70,580 | $0 | $0 |
| 2020 | $1,257 | $68,530 | $0 | $0 |
| 2019 | $1,224 | $66,540 | $0 | $0 |
| 2018 | $1,167 | $64,610 | $0 | $0 |
| 2017 | $1,120 | $62,730 | $0 | $0 |
| 2016 | $988 | $60,910 | $0 | $0 |
Source: Public Records
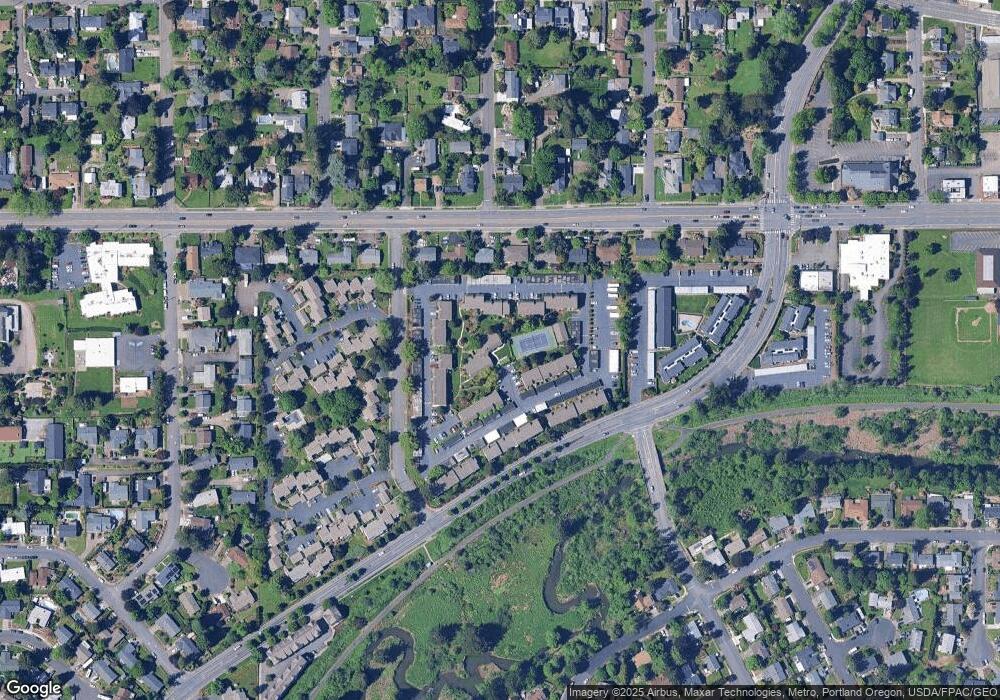
Map
Nearby Homes
- 159 SW Florence Ave Unit 64
- 159 SW Florence Ave
- 645 W Powell Blvd
- 1113 W Powell Blvd
- 638 SW 7th St
- 1325 NW 9th St
- 994 NW Wallula Ave
- 0 NE 5th St
- 765 NW Angeline Ave
- 44 SW Birdsdale Dr
- 1175 SW Chastain Dr
- 318 NE Roberts Ave Unit 308
- 318 NE Roberts Ave Unit 203
- 1745 NW 7th Place
- 1407 SW Walters Dr
- 2095 NW 3rd St
- 415 SE Roberts Ave
- 417 SE Roberts Ave
- 55 SW Lovhar Dr
- 230 NW Mawrcrest Ave
- 200 SW Florence Ave Unit I128
- 200 SW Florence Ave Unit G2
- 200 SW Florence Ave Unit G1
- 200 SW Florence Ave Unit G4
- 200 SW Florence Ave Unit G7
- 200 SW Florence Ave Unit G6
- 200 SW Florence Ave Unit G5
- 200 SW Florence Ave Unit G10
- 200 SW Florence Ave Unit G9
- 200 SW Florence Ave Unit G8
- 200 SW Florence Ave Unit G12
- 200 SW Florence Ave Unit G11
- 200 SW Florence Ave Unit G14
- 200 SW Florence Ave Unit G13
- 200 SW Florence Ave Unit G17
- 200 SW Florence Ave Unit G16
- 200 SW Florence Ave Unit G15
- 200 SW Florence Ave Unit H2
- 200 SW Florence Ave Unit H3
- 200 SW Florence Ave Unit H1
Your Personal Tour Guide
Ask me questions while you tour the home.