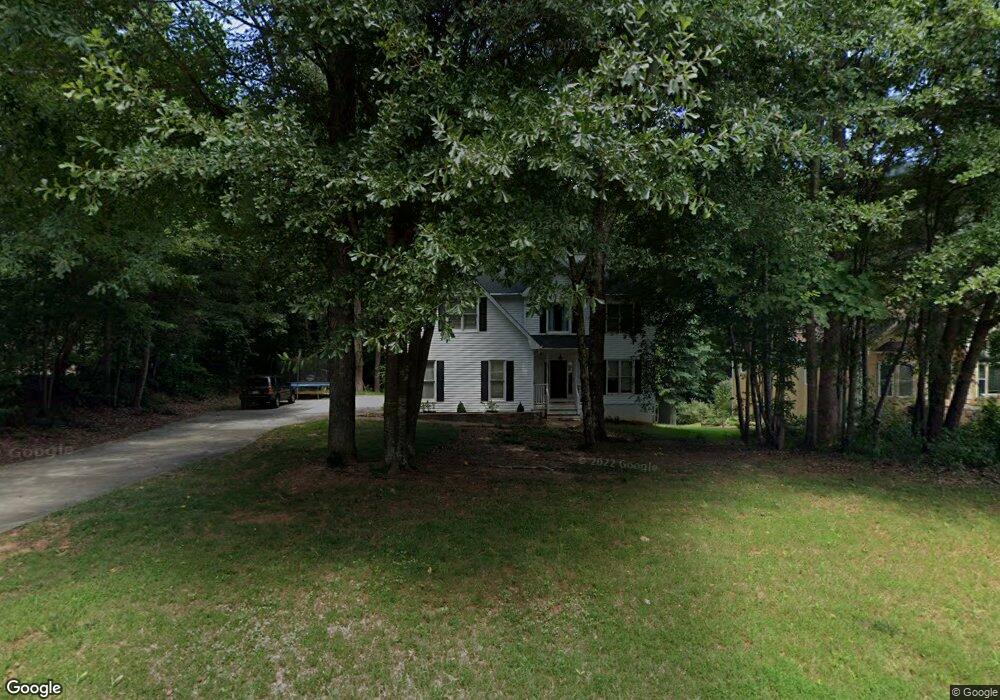
200 Tomahawk Dr Sharpsburg, GA 30277
Estimated Value: $444,559 - $487,000
4
Beds
3
Baths
3,012
Sq Ft
$153/Sq Ft
Est. Value
About This Home
This home is located at 200 Tomahawk Dr, Sharpsburg, GA 30277 and is currently estimated at $461,890, approximately $153 per square foot. 200 Tomahawk Dr is a home located in Coweta County with nearby schools including Thomas Crossroads Elementary School, Lee Middle School, and Northgate High School.
Ownership History
Date
Name
Owned For
Owner Type
Purchase Details
Closed on
Mar 10, 2017
Sold by
Loar Robert M
Bought by
Bayne Stephen D and Bayne Carla K
Current Estimated Value
Home Financials for this Owner
Home Financials are based on the most recent Mortgage that was taken out on this home.
Original Mortgage
$188,000
Outstanding Balance
$155,525
Interest Rate
4.17%
Mortgage Type
New Conventional
Estimated Equity
$306,365
Purchase Details
Closed on
May 27, 1994
Sold by
Westar Bldrs
Bought by
Loar Rbt M and Loar Gloria A
Home Financials for this Owner
Home Financials are based on the most recent Mortgage that was taken out on this home.
Original Mortgage
$137,650
Interest Rate
8.73%
Mortgage Type
Purchase Money Mortgage
Purchase Details
Closed on
Jan 5, 1994
Bought by
Weststar Builders
Purchase Details
Closed on
Aug 11, 1993
Bought by
Mc Intosh Properties
Purchase Details
Closed on
May 14, 1992
Bought by
Carpenter Thomas All
Purchase Details
Closed on
Jul 31, 1987
Bought by
Barnes Harry J
Create a Home Valuation Report for This Property
The Home Valuation Report is an in-depth analysis detailing your home's value as well as a comparison with similar homes in the area
Home Values in the Area
Average Home Value in this Area
Purchase History
| Date | Buyer | Sale Price | Title Company |
|---|---|---|---|
| Bayne Stephen D | $235,000 | -- | |
| Loar Rbt M | $153,000 | -- | |
| Weststar Builders | $15,000 | -- | |
| Mc Intosh Properties | -- | -- | |
| Carpenter Thomas All | $226,300 | -- | |
| Barnes Harry J | $690,100 | -- |
Source: Public Records
Mortgage History
| Date | Status | Borrower | Loan Amount |
|---|---|---|---|
| Open | Bayne Stephen D | $188,000 | |
| Previous Owner | Loar Rbt M | $137,650 |
Source: Public Records
Tax History Compared to Growth
Tax History
| Year | Tax Paid | Tax Assessment Tax Assessment Total Assessment is a certain percentage of the fair market value that is determined by local assessors to be the total taxable value of land and additions on the property. | Land | Improvement |
|---|---|---|---|---|
| 2025 | $3,714 | $157,189 | $34,000 | $123,189 |
| 2024 | $3,549 | $152,891 | $34,000 | $118,891 |
| 2023 | $3,549 | $153,425 | $20,000 | $133,425 |
| 2022 | $3,216 | $130,542 | $20,000 | $110,542 |
| 2021 | $2,929 | $111,240 | $20,000 | $91,240 |
| 2020 | $2,948 | $111,240 | $20,000 | $91,240 |
| 2019 | $2,742 | $93,690 | $12,000 | $81,690 |
| 2018 | $2,747 | $93,690 | $12,000 | $81,690 |
| 2017 | $2,606 | $93,690 | $12,000 | $81,690 |
| 2016 | $2,577 | $93,690 | $12,000 | $81,690 |
| 2015 | $2,536 | $93,690 | $12,000 | $81,690 |
| 2014 | $2,271 | $84,937 | $12,000 | $72,937 |
Source: Public Records
Map
Nearby Homes
- 75 Tomahawk Dr
- 115 Platinum Ridge
- 10 Queens Ct
- 95 Tyler Woods Dr
- 10 Fisher Way
- 12 Race Point Way
- 121 Northwoods Rd
- 2039 Fischer Rd
- 2043 Fischer Rd
- 208 Silver Maple Ct
- 125 Cannongate Cir
- 107 Iron Oak Dr
- 68 Timbercreek Estates Dr
- 0 Maple Trail
- 75 Kripple Kreek Dr
- 131 Cannongate Cir
- 395 Beaumont Farms Dr
- 223 Sweetbay Ct
- 125 Red Maple Dr
- 374 Beaumont Farms Dr
- 210 Tomahawk Dr
- 23 Tomahawk Ct
- 205 Tomahawk Dr
- 220 Tomahawk Dr
- 209 Tomahawk Dr Unit 30
- 209 Tomahawk Dr
- 35 Tomahawk Ct
- 189 Tomahawk Dr
- 0 Tomahawk Ct Unit 8357954
- 0 Tomahawk Ct Unit 8233195
- 236 Tomahawk Dr
- 225 Tomahawk Dr
- 18 Tomahawk Ct
- 30 Tomahawk Ct
- 180 Tomahawk Dr
- 8 Tomahawk Ct
- 34 Tomahawk Ct
- 175 Tomahawk Dr
- 126 Blackfoot Trail
- 240 Tomahawk Dr