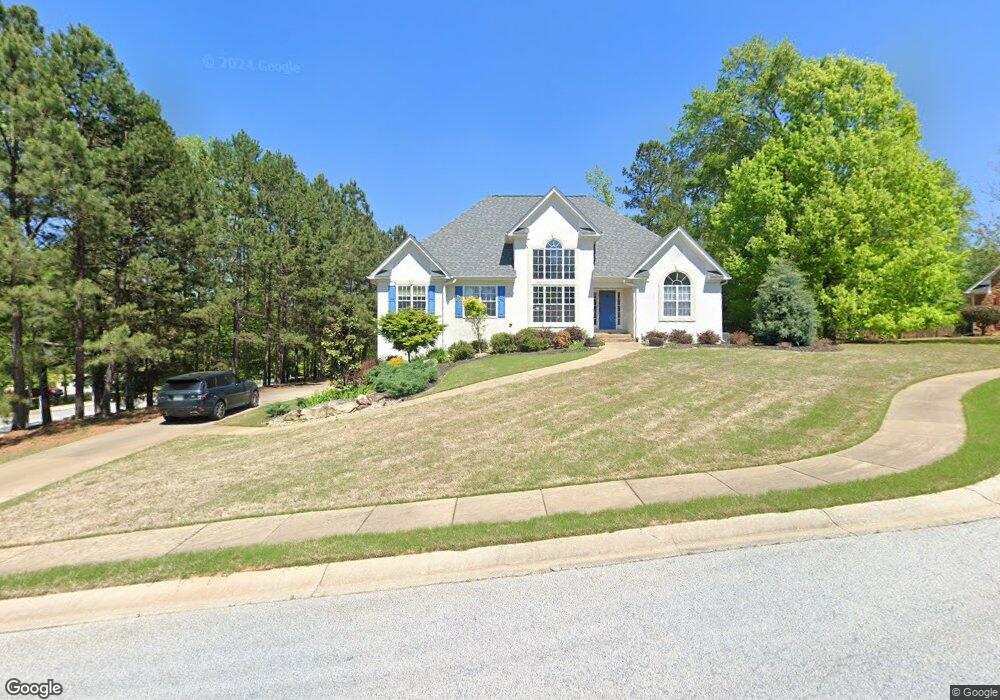
200 Vinestone Ct Unit FURNISHED/UTILITIES Fayetteville, GA 30215
Estimated Value: $417,681 - $452,000
3
Beds
3
Baths
2,560
Sq Ft
$169/Sq Ft
Est. Value
About This Home
This home is located at 200 Vinestone Ct Unit FURNISHED/UTILITIES, Fayetteville, GA 30215 and is currently estimated at $433,420, approximately $169 per square foot. 200 Vinestone Ct Unit FURNISHED/UTILITIES is a home located in Fayette County with nearby schools including Cleveland Elementary School, Bennett's Mill Middle School, and Fayette County High School.
Ownership History
Date
Name
Owned For
Owner Type
Purchase Details
Closed on
Dec 15, 2015
Sold by
Rea Barbara S
Bought by
Hugghins Jacob
Current Estimated Value
Home Financials for this Owner
Home Financials are based on the most recent Mortgage that was taken out on this home.
Original Mortgage
$207,000
Outstanding Balance
$166,459
Interest Rate
3.98%
Mortgage Type
New Conventional
Estimated Equity
$266,961
Purchase Details
Closed on
Jun 12, 2008
Sold by
Veterans Admn
Bought by
Rea Barbara S
Purchase Details
Closed on
Jun 5, 2007
Sold by
Wells Fargo Bank Na
Bought by
Hud
Purchase Details
Closed on
Oct 28, 2002
Sold by
Ray M Wright Inc
Bought by
Haack Margaret M and Haack John W
Home Financials for this Owner
Home Financials are based on the most recent Mortgage that was taken out on this home.
Original Mortgage
$216,550
Interest Rate
5.95%
Mortgage Type
VA
Create a Home Valuation Report for This Property
The Home Valuation Report is an in-depth analysis detailing your home's value as well as a comparison with similar homes in the area
Home Values in the Area
Average Home Value in this Area
Purchase History
| Date | Buyer | Sale Price | Title Company |
|---|---|---|---|
| Hugghins Jacob | $230,000 | -- | |
| Rea Barbara S | -- | -- | |
| Hud | -- | -- | |
| Wells Fargo Bank Na | $220,099 | -- | |
| Haack Margaret M | $212,400 | -- |
Source: Public Records
Mortgage History
| Date | Status | Borrower | Loan Amount |
|---|---|---|---|
| Open | Hugghins Jacob | $207,000 | |
| Previous Owner | Haack Margaret M | $216,550 |
Source: Public Records
Tax History Compared to Growth
Tax History
| Year | Tax Paid | Tax Assessment Tax Assessment Total Assessment is a certain percentage of the fair market value that is determined by local assessors to be the total taxable value of land and additions on the property. | Land | Improvement |
|---|---|---|---|---|
| 2024 | $4,747 | $159,728 | $32,000 | $127,728 |
| 2023 | $4,820 | $158,360 | $32,000 | $126,360 |
| 2022 | $4,101 | $134,960 | $22,000 | $112,960 |
| 2021 | $3,297 | $107,120 | $22,000 | $85,120 |
| 2020 | $3,223 | $104,240 | $22,000 | $82,240 |
| 2019 | $3,116 | $99,800 | $22,000 | $77,800 |
| 2018 | $2,953 | $93,600 | $17,600 | $76,000 |
| 2017 | $2,805 | $93,800 | $17,600 | $76,200 |
| 2016 | $2,660 | $87,040 | $17,600 | $69,440 |
| 2015 | $785 | $83,840 | $17,600 | $66,240 |
| 2014 | $722 | $74,280 | $17,600 | $56,680 |
| 2013 | -- | $62,800 | $0 | $0 |
Source: Public Records
Map
Nearby Homes
- 120 Godby Dr
- 155 Mine Run
- 165 Blackjack Ct
- 180 Sunderland Cir
- 262 Otter Cir
- 322 Hambrick Park
- 140 Ridgecrest Dr Unit 2
- 130 Edgewater Trail
- 175 Ferncliff
- 490 Grand Teton Cir
- 227 Blue Point Pkwy
- 470 Grand Teton Cir
- 335 Grand Teton Cir
- 155 Cottage Cir
- 360 Grand Teton Cir
- 135 Waterlace Way
- 230 Hidden Brook Trail
- 140 Rockglen Ct
- 125 Nina Celeste Ln
- 180 Dockside Dr Unit LOT 385
- 200 Vinestone Ct
- 200 Vinestone Ct Unit 82
- 160 Briarsweet Way
- 160 Briarsweet Way
- 160 Briarsweet Way
- 210 Vinestone Ct
- 205 Vinestone Ct Unit 86
- 205 Vinestone Ct
- 175 Briarsweet Way Unit 71
- 175 Briarsweet Way
- 215 Vinestone Ct
- 225 Vinestone Ct
- 150 Briarsweet Way
- 145 Briarsweet Way
- 185 Briarsweet Way
- 195 Briarsweet Way Unit 69
- 195 Briarsweet Way
- 140 Briarsweet Way
- 140 Briarsweet Way Unit 140
- 0 Briarsweet Way Unit 8657964