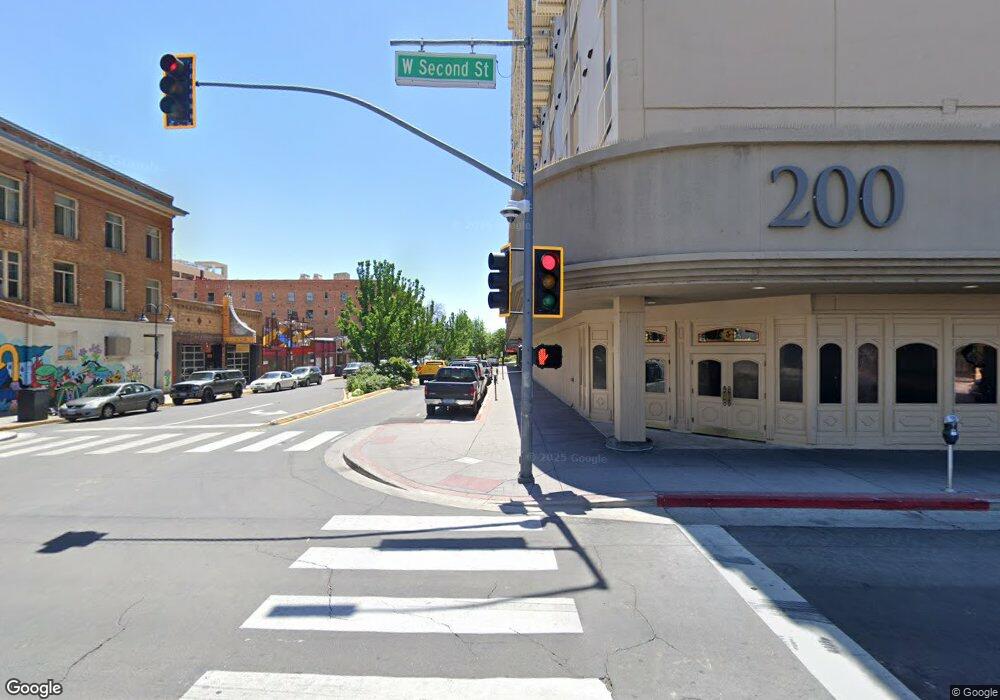
Residences at Riverwalk Towers 200 W 2nd St Unit 1504 Reno, NV 89501
Riverwalk NeighborhoodEstimated Value: $407,000 - $831,000
2
Beds
3
Baths
1,561
Sq Ft
$335/Sq Ft
Est. Value
About This Home
This home is located at 200 W 2nd St Unit 1504, Reno, NV 89501 and is currently estimated at $523,416, approximately $335 per square foot. 200 W 2nd St Unit 1504 is a home located in Washoe County with nearby schools including Hunter Lake Elementary School, Darrell C Swope Middle School, and Reno High School.
Ownership History
Date
Name
Owned For
Owner Type
Purchase Details
Closed on
Oct 28, 2021
Sold by
Smyly Robert D
Bought by
Smyly Robert D and Robert D Smyly Family Trust
Current Estimated Value
Purchase Details
Closed on
Sep 22, 2010
Sold by
Wallach Lewis and Harrison Wallach Cynthia
Bought by
Smyly Robert D
Home Financials for this Owner
Home Financials are based on the most recent Mortgage that was taken out on this home.
Original Mortgage
$85,000
Outstanding Balance
$55,170
Interest Rate
4.26%
Mortgage Type
Unknown
Estimated Equity
$468,246
Purchase Details
Closed on
Jun 4, 2008
Sold by
Wallach Lewis
Bought by
Wallach Lewis and Harrison Wallach Cynthia
Purchase Details
Closed on
Feb 1, 2006
Sold by
Riverwalk Development Llc
Bought by
Wallach Lewis and Wallach Kim
Home Financials for this Owner
Home Financials are based on the most recent Mortgage that was taken out on this home.
Original Mortgage
$400,500
Interest Rate
6.5%
Mortgage Type
Unknown
Create a Home Valuation Report for This Property
The Home Valuation Report is an in-depth analysis detailing your home's value as well as a comparison with similar homes in the area
Home Values in the Area
Average Home Value in this Area
Purchase History
| Date | Buyer | Sale Price | Title Company |
|---|---|---|---|
| Smyly Robert D | -- | None Available | |
| Smyly Robert D | $130,000 | First Centennial Reno | |
| Wallach Lewis | -- | None Available | |
| Wallach Lewis | $534,000 | Ticor Title Of Nevada Inc |
Source: Public Records
Mortgage History
| Date | Status | Borrower | Loan Amount |
|---|---|---|---|
| Open | Smyly Robert D | $85,000 | |
| Previous Owner | Wallach Lewis | $400,500 |
Source: Public Records
Tax History
| Year | Tax Paid | Tax Assessment Tax Assessment Total Assessment is a certain percentage of the fair market value that is determined by local assessors to be the total taxable value of land and additions on the property. | Land | Improvement |
|---|---|---|---|---|
| 2026 | -- | $103,465 | $26,478 | $76,987 |
| 2024 | $1,461 | $104,028 | $26,478 | $141,001 |
| 2023 | $708 | $133,611 | $30,625 | $128,732 |
| 2022 | $2,012 | $137,517 | $28,350 | $109,167 |
| 2021 | $1,959 | $134,537 | $22,750 | $111,787 |
| 2020 | $1,903 | $131,201 | $19,670 | $111,531 |
| 2019 | $1,800 | $115,955 | $19,670 | $96,285 |
| 2018 | $1,641 | $103,870 | $18,025 | $85,845 |
| 2017 | $1,619 | $86,647 | $16,065 | $70,582 |
| 2016 | $1,619 | $78,159 | $12,530 | $65,629 |
| 2015 | $1,193 | $70,991 | $11,235 | $59,756 |
| 2014 | $1,421 | $43,791 | $6,825 | $36,966 |
| 2013 | -- | $29,695 | $5,460 | $24,235 |
Source: Public Records
About Residences at Riverwalk Towers
Map
Nearby Homes
- 200 W 2nd St Unit 1506
- 200 W 2nd St Unit 502
- 200 W 2nd St Unit 705
- 200 W 2nd St Unit 501
- 200 W 2nd St Unit 1104
- 200 W 2nd St Unit 1103
- 100 N Arlington Ave Unit 22G
- 100 N Arlington Ave Unit 10E
- 100 N Arlington Ave Unit 21K
- 100 N Arlington Ave Unit 15e
- 100 N Arlington Ave Unit 6G
- 100 N Arlington Ave Unit 8J
- 100 N Arlington Ave Unit 7K
- 100 N Arlington Ave Unit 7I
- 100 N Arlington Ave Unit 22H
- 100 N Arlington Ave Unit 17G
- 100 N Arlington Ave Unit 23P
- 100 N Arlington Ave Unit 6E
- 255 N Sierra St Unit 1011
- 255 N Sierra St Unit 407
- 200 W 2nd St Unit 409
- 200 W 2nd St Unit 1009
- 200 W 2nd St Unit 1201
- 200 W 2nd St Unit 403
- 200 W 2nd St Unit Luxury Furnished Con
- 200 W 2nd St
- 200 W 2nd St Unit 407
- 200 W 2nd St Unit 1605
- 200 W 2nd St
- 200 W 2nd St Unit 1603
- 200 W 2nd St Unit 1602
- 200 W 2nd St Unit 1601
- 200 W 2nd St Unit 1510
- 200 W 2nd St Unit 1509
- 200 W 2nd St Unit 1507
- 200 W 2nd St Unit 1505
- 200 W 2nd St Unit 1503
- 200 W 2nd St Unit 1502
- 200 W 2nd St
- 200 W 2nd St
Your Personal Tour Guide
Ask me questions while you tour the home.