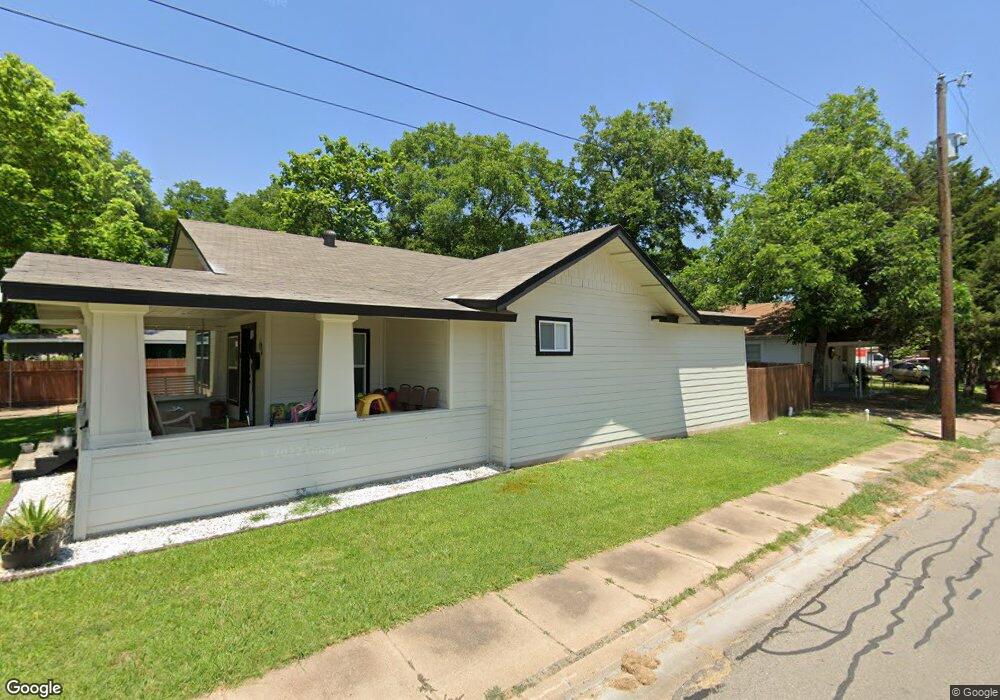
200 W 7th St Bonham, TX 75418
Estimated Value: $252,368 - $295,000
4
Beds
3
Baths
1,735
Sq Ft
$161/Sq Ft
Est. Value
About This Home
This home is located at 200 W 7th St, Bonham, TX 75418 and is currently estimated at $279,342, approximately $161 per square foot. 200 W 7th St is a home located in Fannin County with nearby schools including Evans Elementary School, Finley-Oates Elementary School, and LH Rather Jr High School.
Ownership History
Date
Name
Owned For
Owner Type
Purchase Details
Closed on
Feb 27, 2020
Sold by
Raw Equity Group Llc
Bought by
Brooks Roger E
Current Estimated Value
Home Financials for this Owner
Home Financials are based on the most recent Mortgage that was taken out on this home.
Original Mortgage
$171,731
Outstanding Balance
$154,570
Interest Rate
4.62%
Mortgage Type
FHA
Estimated Equity
$124,772
Purchase Details
Closed on
Sep 11, 2019
Sold by
Sigler Samuel and Sigler Rachel
Bought by
Raw Equity Group Llc and Raw Acquisitions
Home Financials for this Owner
Home Financials are based on the most recent Mortgage that was taken out on this home.
Original Mortgage
$136,460
Interest Rate
3.6%
Mortgage Type
Purchase Money Mortgage
Purchase Details
Closed on
Dec 5, 2017
Sold by
Killgo Buys Houses Llc
Bought by
Sigler Samuel and Sigler Rachel
Purchase Details
Closed on
Dec 5, 2014
Sold by
Pettit Jarrod
Bought by
Apfsdemm Inc
Create a Home Valuation Report for This Property
The Home Valuation Report is an in-depth analysis detailing your home's value as well as a comparison with similar homes in the area
Purchase History
| Date | Buyer | Sale Price | Title Company |
|---|---|---|---|
| Brooks Roger E | -- | Red River Title | |
| Raw Equity Group Llc | -- | North American Title | |
| Sigler Samuel | -- | None Available | |
| Apfsdemm Inc | -- | None Available |
Source: Public Records
Mortgage History
| Date | Status | Borrower | Loan Amount |
|---|---|---|---|
| Open | Brooks Roger E | $171,731 | |
| Previous Owner | Raw Equity Group Llc | $136,460 |
Source: Public Records
Tax History
| Year | Tax Paid | Tax Assessment Tax Assessment Total Assessment is a certain percentage of the fair market value that is determined by local assessors to be the total taxable value of land and additions on the property. | Land | Improvement |
|---|---|---|---|---|
| 2025 | $5,096 | $262,720 | $30,350 | $232,370 |
| 2024 | $4,246 | $270,920 | $29,840 | $241,080 |
| 2023 | $5,077 | $257,460 | $20,260 | $237,200 |
| 2022 | $5,200 | $236,420 | $13,600 | $222,820 |
| 2021 | $5,021 | $198,650 | $8,120 | $190,530 |
| 2020 | $4,889 | $191,280 | $6,580 | $184,700 |
| 2019 | $1,003 | $37,740 | $4,020 | $33,720 |
| 2018 | $539 | $20,310 | $3,580 | $16,730 |
| 2017 | $92 | $3,580 | $3,580 | $0 |
| 2016 | $697 | $27,290 | $5,340 | $21,950 |
| 2015 | -- | $25,000 | $5,190 | $19,810 |
| 2014 | -- | $21,380 | $4,610 | $16,770 |
Source: Public Records
Map
Nearby Homes
- 300 W 6th St
- 320 W 6th St
- 415 W 7th St
- 417 W 8th St
- 1220 Maple St
- 1007 Willow St
- 611 Chestnut St
- 419 W 5th St
- LOT 2 TBD County Road 2005
- TBD W Fm 274
- TBD LOT 1 County Road 2005
- tbd lot 3 County Road 2005
- 814 Chestnut St
- 520 W 9th St
- 818 W 9th St
- 401 W Sam Rayburn Dr Unit 1
- 410 W 11th St
- 505 W 3rd St
- 410 E 6th St
- 709 Beech St
Your Personal Tour Guide
Ask me questions while you tour the home.