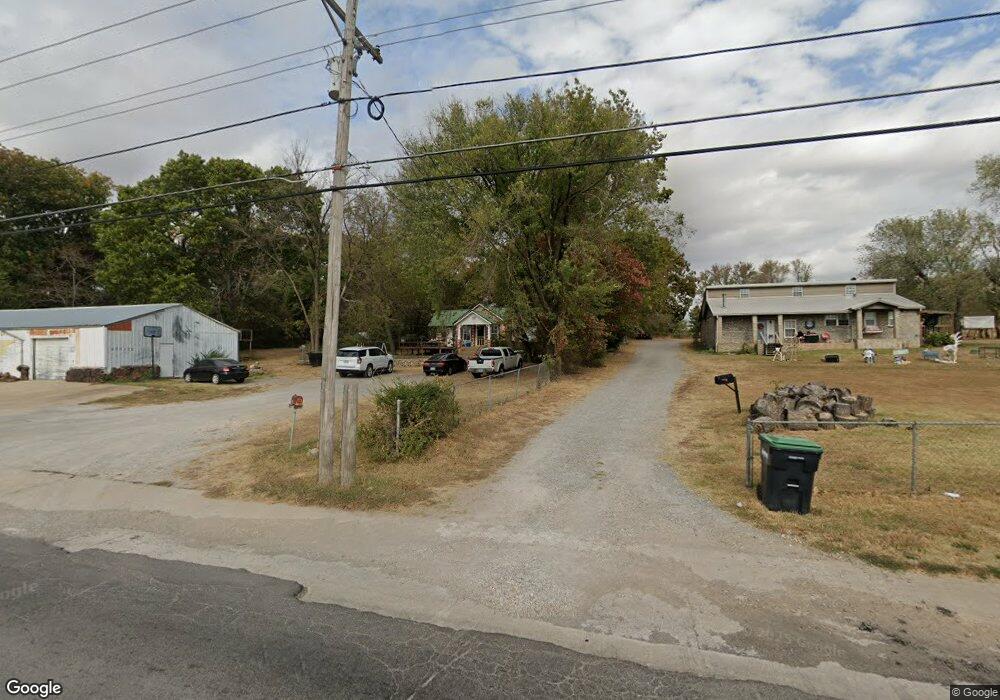
200 W Allen Rd Tahlequah, OK 74464
Estimated Value: $159,945 - $193,000
3
Beds
2
Baths
1,226
Sq Ft
$144/Sq Ft
Est. Value
About This Home
This home is located at 200 W Allen Rd, Tahlequah, OK 74464 and is currently estimated at $176,486, approximately $143 per square foot. 200 W Allen Rd is a home located in Cherokee County with nearby schools including Grand View Public School, Agape Christian Academy, and Shiloh Christian School.
Ownership History
Date
Name
Owned For
Owner Type
Purchase Details
Closed on
Aug 26, 2002
Sold by
Fabian Teague
Bought by
Fabian and Ashley Teague
Current Estimated Value
Purchase Details
Closed on
Aug 21, 2002
Sold by
Teague Fabian and Teague Ashley
Bought by
Teague Fabian and Teague Ashley
Purchase Details
Closed on
Oct 2, 1997
Sold by
Ray and Eujeanna Teague
Bought by
Fabian Teague
Create a Home Valuation Report for This Property
The Home Valuation Report is an in-depth analysis detailing your home's value as well as a comparison with similar homes in the area
Home Values in the Area
Average Home Value in this Area
Purchase History
| Date | Buyer | Sale Price | Title Company |
|---|---|---|---|
| Fabian | -- | -- | |
| Teague Fabian | -- | None Available | |
| Fabian Teague | $90,000 | -- |
Source: Public Records
Tax History Compared to Growth
Tax History
| Year | Tax Paid | Tax Assessment Tax Assessment Total Assessment is a certain percentage of the fair market value that is determined by local assessors to be the total taxable value of land and additions on the property. | Land | Improvement |
|---|---|---|---|---|
| 2025 | $747 | $9,359 | $2,090 | $7,269 |
| 2024 | $747 | $8,993 | $2,090 | $6,903 |
| 2023 | $747 | $9,848 | $2,090 | $7,758 |
| 2022 | $674 | $9,503 | $2,090 | $7,413 |
| 2021 | $642 | $9,051 | $2,090 | $6,961 |
| 2020 | $612 | $8,620 | $2,090 | $6,530 |
| 2019 | $636 | $8,209 | $2,090 | $6,119 |
| 2018 | $610 | $7,818 | $2,090 | $5,728 |
| 2017 | $585 | $7,446 | $2,090 | $5,356 |
| 2016 | $561 | $7,092 | $2,090 | $5,002 |
| 2015 | $530 | $6,754 | $2,090 | $4,664 |
| 2014 | $491 | $6,237 | $1,353 | $4,884 |
Source: Public Records
Map
Nearby Homes
- 112 W Allen Rd
- 1408 Trimble Ave
- 1406 Skipper Ave
- 2020 N Everly Dr
- 2021 N Everly Dr
- 2000 N Everly Dr
- 1930 N Everly Dr
- 2010 N Everly Dr
- 2030 N Everly Dr
- 2031 N Everly Dr
- 2040 N Everly Dr
- 1325 N Vinita Ave
- 3063 Mountain
- 1032 Watercolor
- 1189 Watercolor
- 15300 N Jarvis
- 947 Seagrove
- 932 Watercolor
- 978 Seagrove
- 1281 Watercolor