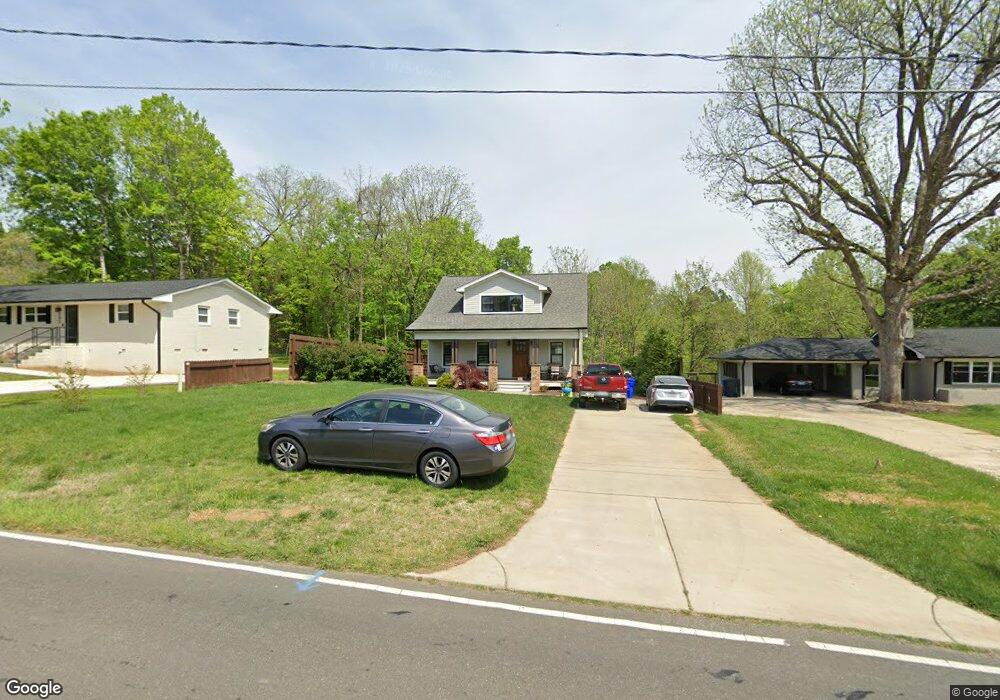
200 W Corbin St Hillsborough, NC 27278
Estimated Value: $609,000 - $627,000
4
Beds
2
Baths
1,221
Sq Ft
$507/Sq Ft
Est. Value
About This Home
This home is located at 200 W Corbin St, Hillsborough, NC 27278 and is currently estimated at $618,534, approximately $506 per square foot. 200 W Corbin St is a home located in Orange County with nearby schools including River Park Elementary School, Orange Middle School, and The Expedition School.
Ownership History
Date
Name
Owned For
Owner Type
Purchase Details
Closed on
Aug 28, 2025
Sold by
Ratliff William R and Ratliff Katherine M
Bought by
Had And Hold Iii Llc
Current Estimated Value
Purchase Details
Closed on
Mar 23, 2020
Sold by
Grayronse Properties Llc
Bought by
Ratiff William R and Ratiff Katherine M
Home Financials for this Owner
Home Financials are based on the most recent Mortgage that was taken out on this home.
Original Mortgage
$368,900
Interest Rate
3.4%
Mortgage Type
New Conventional
Purchase Details
Closed on
Aug 28, 2018
Sold by
My Dog Tess Inc
Bought by
Grayrose Properties Llc
Purchase Details
Closed on
Aug 22, 2018
Sold by
Farmhouse Properties Llc
Bought by
My Dog Tess Inc
Purchase Details
Closed on
Jul 19, 2018
Sold by
Rainey Charles W and Rainey Millicent C
Bought by
Farm House Properties Llc
Purchase Details
Closed on
Feb 1, 1973
Bought by
Rainey and Rainey
Create a Home Valuation Report for This Property
The Home Valuation Report is an in-depth analysis detailing your home's value as well as a comparison with similar homes in the area
Home Values in the Area
Average Home Value in this Area
Purchase History
| Date | Buyer | Sale Price | Title Company |
|---|---|---|---|
| Had And Hold Iii Llc | $600,000 | None Listed On Document | |
| Ratiff William R | $434,000 | None Available | |
| Grayrose Properties Llc | $105,000 | None Available | |
| My Dog Tess Inc | $70,000 | None Available | |
| Farm House Properties Llc | -- | None Available | |
| Rainey | $8,600 | -- |
Source: Public Records
Mortgage History
| Date | Status | Borrower | Loan Amount |
|---|---|---|---|
| Previous Owner | Ratiff William R | $368,900 |
Source: Public Records
Tax History Compared to Growth
Tax History
| Year | Tax Paid | Tax Assessment Tax Assessment Total Assessment is a certain percentage of the fair market value that is determined by local assessors to be the total taxable value of land and additions on the property. | Land | Improvement |
|---|---|---|---|---|
| 2025 | $6,899 | $578,100 | $170,000 | $408,100 |
| 2024 | $6,582 | $432,300 | $50,000 | $382,300 |
| 2023 | $6,366 | $432,300 | $50,000 | $382,300 |
| 2022 | $6,348 | $432,300 | $50,000 | $382,300 |
| 2021 | $6,294 | $432,300 | $50,000 | $382,300 |
| 2020 | $4,705 | $301,600 | $33,500 | $268,100 |
| 2018 | $0 | $103,000 | $31,500 | $71,500 |
| 2017 | $1,768 | $103,000 | $31,500 | $71,500 |
| 2016 | $1,768 | $94,918 | $35,226 | $59,692 |
| 2015 | $1,693 | $94,918 | $35,226 | $59,692 |
| 2014 | $1,613 | $94,918 | $35,226 | $59,692 |
Source: Public Records
Map
Nearby Homes
- 639 Mcadams Rd
- 620 Mcadams Rd
- 615 N Churton St
- 2340 Turner St
- 515 N Churton St Unit 203
- 611 N Churton St
- 200 Cornelius St
- 320 W Orange St
- 110 E Orange St
- 621 Childsberg Way
- 0 Highway 86
- 200 Nc Highway 86 N
- 215 N Occoneechee St
- 158 Torain St
- 209 N Occoneechee St
- 170 Torain St
- 527 Cornelius St
- 152 E Tryon St
- 511 Revere Rd
- 125 N Nash St
- 130 W Corbin St
- 130 W Corbin St
- 130 W Corbin St
- 130 W Corbin St
- 202 W Corbin St
- 204 W Corbin St
- 130 W Corbin St
- 130 & 200 W Corbin St
- 1141 N Wake St
- 206 & 208 W Corbin St
- 206 W Corbin St
- 208 W Corbin St
- 120 W Corbin St
- 515 N Wake St
- 107 Maplewood Rd
- 207 W Corbin St
- 127 W Corbin St
- 654 Cedar St
- 662 Cedar St
- 509 N Wake St