Estimated Value: $3,364,000 - $5,246,000
--
Bed
--
Bath
2,256
Sq Ft
$2,009/Sq Ft
Est. Value
About This Home
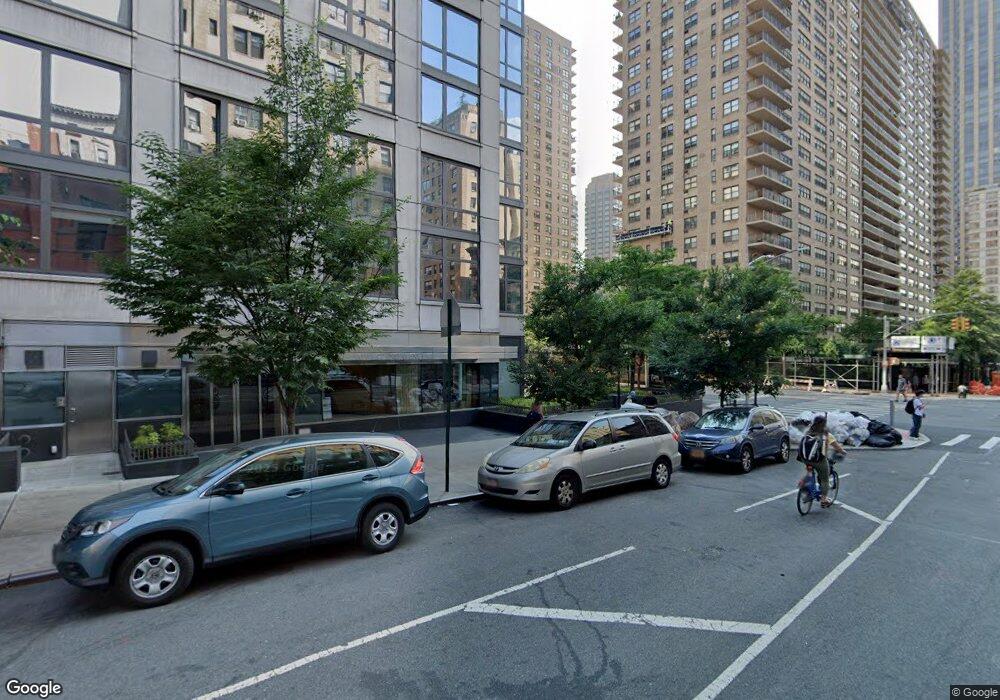
This home is located at 200 W End Ave Unit PHA, New York, NY 10023 and is currently estimated at $4,531,617, approximately $2,008 per square foot. 200 W End Ave Unit PHA is a home located in New York County with nearby schools including PS 199 Jessie Isador Straus, Manhattan Day School, and West End Day School.
Ownership History
Date
Name
Owned For
Owner Type
Purchase Details
Closed on
Mar 24, 2025
Sold by
Steel Mountain Llc
Bought by
Hahn Shin Young and Ham Dong Sung
Current Estimated Value
Home Financials for this Owner
Home Financials are based on the most recent Mortgage that was taken out on this home.
Original Mortgage
$3,187,500
Outstanding Balance
$3,168,411
Interest Rate
6.87%
Mortgage Type
Purchase Money Mortgage
Estimated Equity
$1,363,206
Purchase Details
Closed on
May 2, 2011
Sold by
Duckworth Mark
Bought by
Steel Mountain Llc
Purchase Details
Closed on
Dec 31, 2009
Sold by
200 Wea Sub Co Llc
Bought by
Duckworth Mark
Home Financials for this Owner
Home Financials are based on the most recent Mortgage that was taken out on this home.
Original Mortgage
$2,000,000
Interest Rate
5.17%
Mortgage Type
Purchase Money Mortgage
Create a Home Valuation Report for This Property
The Home Valuation Report is an in-depth analysis detailing your home's value as well as a comparison with similar homes in the area
Home Values in the Area
Average Home Value in this Area
Purchase History
| Date | Buyer | Sale Price | Title Company |
|---|---|---|---|
| Hahn Shin Young | $4,250,000 | -- | |
| Steel Mountain Llc | -- | -- | |
| Steel Mountain Llc | -- | -- | |
| Duckworth Mark | $3,900,000 | -- | |
| Duckworth Mark | $3,900,000 | -- |
Source: Public Records
Mortgage History
| Date | Status | Borrower | Loan Amount |
|---|---|---|---|
| Open | Hahn Shin Young | $3,187,500 | |
| Previous Owner | Duckworth Mark | $2,000,000 |
Source: Public Records
Tax History Compared to Growth
Tax History
| Year | Tax Paid | Tax Assessment Tax Assessment Total Assessment is a certain percentage of the fair market value that is determined by local assessors to be the total taxable value of land and additions on the property. | Land | Improvement |
|---|---|---|---|---|
| 2025 | $54,211 | $433,876 | $36,794 | $397,082 |
| 2024 | $54,211 | $433,622 | $36,794 | $396,828 |
| 2023 | $52,173 | $425,308 | $36,794 | $388,514 |
| 2022 | $51,058 | $417,308 | $36,794 | $380,514 |
| 2021 | $49,723 | $405,343 | $36,794 | $368,549 |
| 2020 | $52,706 | $456,105 | $36,794 | $419,311 |
| 2019 | $51,229 | $436,711 | $36,794 | $399,917 |
| 2018 | $40,928 | $421,456 | $36,794 | $384,662 |
| 2017 | $40,002 | $406,265 | $36,794 | $369,471 |
| 2016 | $30,283 | $423,826 | $36,794 | $387,032 |
| 2015 | $5,333 | $374,263 | $36,794 | $337,469 |
| 2014 | $5,333 | $371,537 | $36,794 | $334,743 |
Source: Public Records
About This Building
Map
Nearby Homes
- 200 W End Ave Unit 8C
- 200 W End Ave Unit 5H
- 200 W End Ave Unit 14K
- 255 W 70th St
- 180 W End Ave Unit 23G
- 180 W End Ave Unit 9-P
- 180 W End Ave Unit 3C
- 180 W End Ave Unit 3E
- 180 W End Ave Unit 17K
- 180 W End Ave Unit 27A
- 180 W End Ave Unit 14G
- 180 W End Ave Unit 23D
- 180 W End Ave Unit 19R
- 180 W End Ave Unit 25M
- 180 W End Ave Unit 21A
- 180 W End Ave Unit 28S
- 180 W End Ave Unit 5H
- 205 W End Ave Unit 1E
- 205 W End Ave Unit 1M
- 205 W End Ave Unit 8R
- 200 W End Ave
- 200 W End Ave
- 200 W End Ave Unit PHD
- 200 W End Ave Unit PHC
- 200 W End Ave Unit PHB
- 200 W End Ave Unit PHD
- 200 W End Ave Unit 25B
- 200 W End Ave Unit 25A
- 200 W End Ave Unit 24C
- 200 W End Ave Unit 24A
- 200 W End Ave Unit 23B
- 200 W End Ave Unit 23A
- 200 W End Ave Unit 22C
- 200 W End Ave Unit 22B
- 200 W End Ave Unit 22A
- 200 W End Ave Unit 21B
- 200 W End Ave Unit 21A
- 200 W End Ave Unit 20C
- 200 W End Ave Unit 20B
- 200 W End Ave Unit 20A