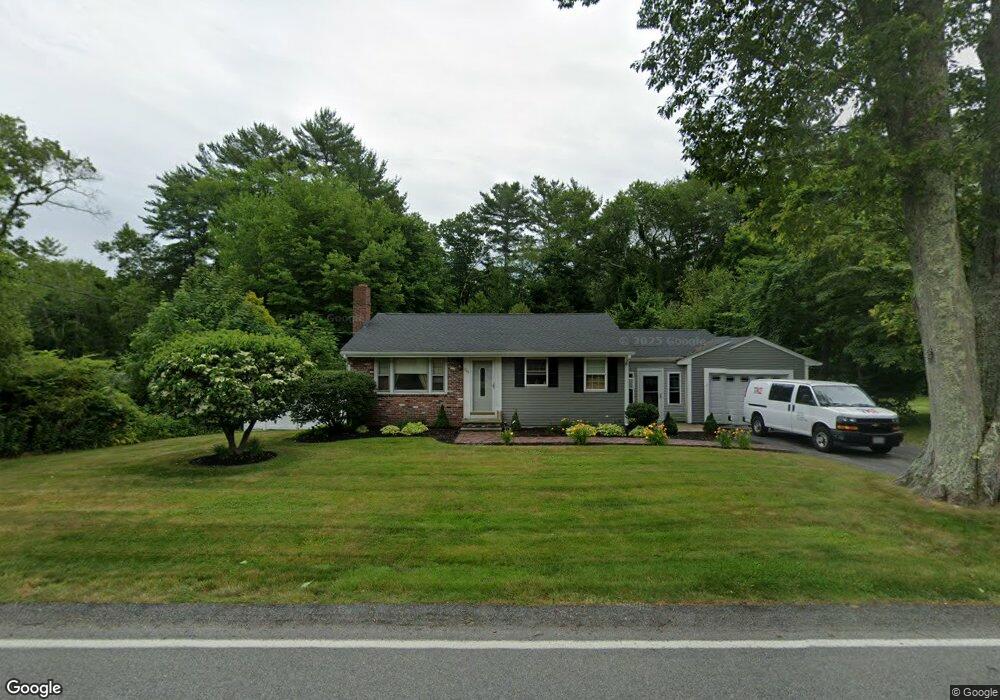
200 Walnut St East Bridgewater, MA 02333
Estimated Value: $479,000 - $527,000
3
Beds
2
Baths
1,020
Sq Ft
$488/Sq Ft
Est. Value
About This Home
This home is located at 200 Walnut St, East Bridgewater, MA 02333 and is currently estimated at $497,281, approximately $487 per square foot. 200 Walnut St is a home located in Plymouth County with nearby schools including Central Elementary School, Gordon W Mitchell Middle School, and East Bridgewater Jr./Sr. High School.
Ownership History
Date
Name
Owned For
Owner Type
Purchase Details
Closed on
Aug 11, 2023
Sold by
Smith Jason F
Bought by
Smith Jason F and Smith Michelle A
Current Estimated Value
Purchase Details
Closed on
Apr 19, 2006
Sold by
Abrams Adam
Bought by
Smith Jason F
Home Financials for this Owner
Home Financials are based on the most recent Mortgage that was taken out on this home.
Original Mortgage
$315,000
Interest Rate
6.37%
Mortgage Type
Purchase Money Mortgage
Purchase Details
Closed on
Jan 21, 2004
Sold by
Katherine B Miltner 19 and Miltner
Bought by
Abrams Adam
Home Financials for this Owner
Home Financials are based on the most recent Mortgage that was taken out on this home.
Original Mortgage
$275,000
Interest Rate
5.89%
Mortgage Type
Purchase Money Mortgage
Create a Home Valuation Report for This Property
The Home Valuation Report is an in-depth analysis detailing your home's value as well as a comparison with similar homes in the area
Home Values in the Area
Average Home Value in this Area
Purchase History
| Date | Buyer | Sale Price | Title Company |
|---|---|---|---|
| Smith Jason F | -- | None Available | |
| Smith Jason F | $350,000 | -- | |
| Abrams Adam | $290,000 | -- |
Source: Public Records
Mortgage History
| Date | Status | Borrower | Loan Amount |
|---|---|---|---|
| Previous Owner | Abrams Adam | $315,000 | |
| Previous Owner | Abrams Adam | $35,000 | |
| Previous Owner | Abrams Adam | $275,000 |
Source: Public Records
Tax History Compared to Growth
Tax History
| Year | Tax Paid | Tax Assessment Tax Assessment Total Assessment is a certain percentage of the fair market value that is determined by local assessors to be the total taxable value of land and additions on the property. | Land | Improvement |
|---|---|---|---|---|
| 2025 | $5,329 | $389,800 | $182,800 | $207,000 |
| 2024 | $5,240 | $378,600 | $175,800 | $202,800 |
| 2023 | $5,225 | $361,600 | $175,800 | $185,800 |
| 2022 | $5,210 | $334,000 | $159,900 | $174,100 |
| 2021 | $0 | $301,100 | $153,600 | $147,500 |
| 2020 | $5,092 | $294,500 | $147,800 | $146,700 |
| 2019 | $4,412 | $285,600 | $141,200 | $144,400 |
| 2018 | $4,795 | $267,000 | $141,200 | $125,800 |
| 2017 | $3,958 | $256,500 | $134,700 | $121,800 |
| 2016 | $4,609 | $253,800 | $134,700 | $119,100 |
| 2015 | $4,479 | $252,200 | $133,700 | $118,500 |
| 2014 | $4,301 | $247,600 | $130,900 | $116,700 |
Source: Public Records
Map
Nearby Homes
- 936 Central St
- 844 Washington St
- 2 Magnolia Cir Unit 2
- 14 Mountain Ash Rd
- 1 Simmons Place
- 1247 Central St
- 9 Daisy Ln
- 217 Crystal Water Dr
- 182 Crystal Water Dr Unit 182
- 572 Harvard St
- 78 Crystal Water Dr
- 11 Harmony Crossing
- 585 N Bedford St
- 611 N Bedford St
- 70 Surrey Ln
- 70 Surrey Ln
- 101 Washington St Unit 4
- 22 Water St
- 848 N Bedford St
- 848 N Bedford St Phase IV