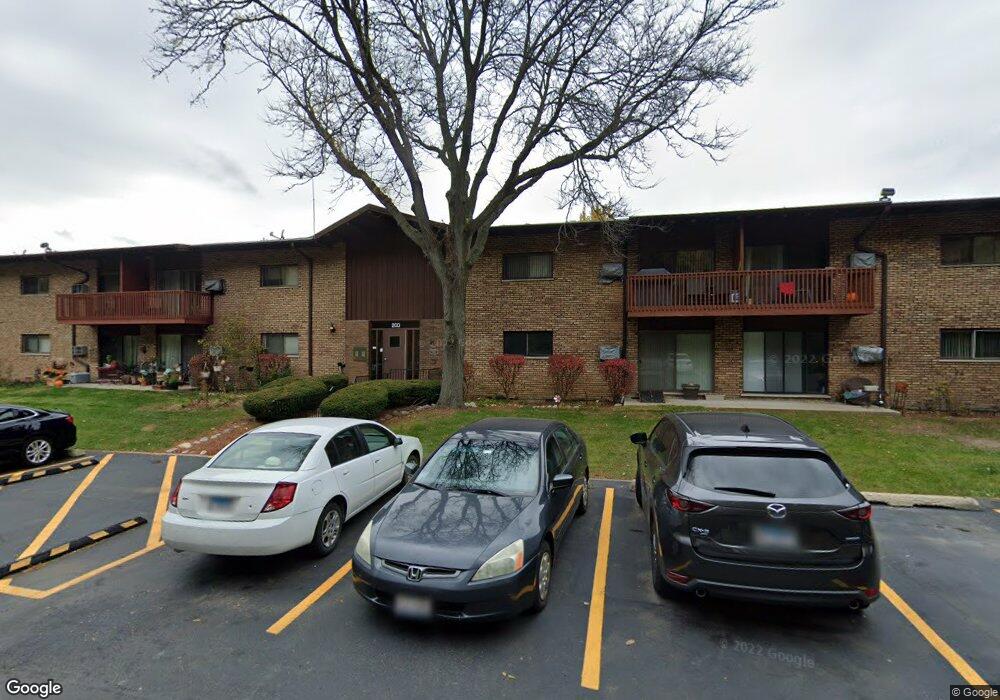
A 200 Willow Ln Unit 2219 Willow Springs, IL 60480
Estimated Value: $163,000 - $198,000
3
Beds
2
Baths
147,669
Sq Ft
$1/Sq Ft
Est. Value
About This Home
This home is located at 200 Willow Ln Unit 2219, Willow Springs, IL 60480 and is currently estimated at $182,402, approximately $1 per square foot. 200 Willow Ln Unit 2219 is a home located in Cook County with nearby schools including Willow Springs Elementary School, Argo Community High School, and Trinity Lutheran School.
Ownership History
Date
Name
Owned For
Owner Type
Purchase Details
Closed on
Feb 8, 2023
Sold by
Us Bank National Association
Bought by
Arias Julio Cesar Lopez
Current Estimated Value
Purchase Details
Closed on
May 16, 2022
Sold by
Cook County
Bought by
Truman 2016 Sc6 Title Trust
Purchase Details
Closed on
Dec 14, 2005
Sold by
Connolley Charles D and Connolley Carmen G
Bought by
Semenic Carol A
Home Financials for this Owner
Home Financials are based on the most recent Mortgage that was taken out on this home.
Original Mortgage
$134,000
Interest Rate
5.87%
Mortgage Type
Purchase Money Mortgage
Purchase Details
Closed on
Oct 24, 2001
Sold by
Standard Bk & Tr Company Of Hickory Hills
Bought by
Lerch Thomas J
Home Financials for this Owner
Home Financials are based on the most recent Mortgage that was taken out on this home.
Original Mortgage
$56,000
Interest Rate
6.69%
Create a Home Valuation Report for This Property
The Home Valuation Report is an in-depth analysis detailing your home's value as well as a comparison with similar homes in the area
Home Values in the Area
Average Home Value in this Area
Purchase History
| Date | Buyer | Sale Price | Title Company |
|---|---|---|---|
| Arias Julio Cesar Lopez | $145,000 | Chicago Title | |
| Truman 2016 Sc6 Title Trust | -- | None Listed On Document | |
| Semenic Carol A | $167,500 | Cti | |
| Lerch Thomas J | $84,000 | -- |
Source: Public Records
Mortgage History
| Date | Status | Borrower | Loan Amount |
|---|---|---|---|
| Previous Owner | Semenic Carol A | $134,000 | |
| Previous Owner | Lerch Thomas J | $56,000 |
Source: Public Records
Tax History Compared to Growth
Tax History
| Year | Tax Paid | Tax Assessment Tax Assessment Total Assessment is a certain percentage of the fair market value that is determined by local assessors to be the total taxable value of land and additions on the property. | Land | Improvement |
|---|---|---|---|---|
| 2024 | $2,930 | $12,857 | $1,851 | $11,006 |
| 2023 | $2,610 | $12,857 | $1,851 | $11,006 |
| 2022 | $2,610 | $9,864 | $2,173 | $7,691 |
| 2021 | $2,608 | $9,863 | $2,172 | $7,691 |
| 2020 | $2,623 | $9,863 | $2,172 | $7,691 |
| 2019 | $1,291 | $6,609 | $2,011 | $4,598 |
| 2018 | $1,248 | $6,609 | $2,011 | $4,598 |
| 2017 | $1,268 | $6,609 | $2,011 | $4,598 |
| 2016 | $925 | $4,639 | $1,770 | $2,869 |
| 2015 | $815 | $4,639 | $1,770 | $2,869 |
| 2014 | $822 | $4,639 | $1,770 | $2,869 |
| 2013 | $1,979 | $8,139 | $1,770 | $6,369 |
Source: Public Records
About A
Map
Nearby Homes
- 106 Kazwell St
- 815 Vinewood Ave
- 1048 Testa Dr
- 8036 Fawn Trail
- 710 Briarwood Dr Unit 710
- 8395 Archer Ave
- 506 S Charleton St
- 7850 Garden Ln
- 8601 S Kean Ave
- 8422 Archer Ave
- 8420 Archer Ave
- 8232 Concord Ln Unit 6B720
- 8121 Concord Ln Unit J
- 8830 Concord Ln Unit 20C723
- 8947 W 83rd St
- 8217 Concord Ln Unit B
- 9141 Meadowview Dr
- 7700 Garden Ln
- 8473 Archer Ave Unit 204
- 7816 Blazer Ave
- 200 Willow Ln Unit 209
- 200 Willow Ln Unit 111
- 200 Willow Ln Unit 2207
- 200 Willow Ln Unit 2110
- 200 Willow Ln Unit 2202
- 200 Willow Ln Unit 2119
- 200 Willow Ln Unit 2111
- 200 Willow Ln Unit 2104
- 200 Willow Ln Unit 2118
- 200 Willow Ln Unit 2216
- 200 Willow Ln Unit 2218
- 200 Willow Ln Unit 2209
- 200 Willow Ln Unit 2201
- 200 Willow Ln Unit 2112
- 200 Willow Ln Unit 2117
- 200 Willow Ln Unit 2103
- 200 Willow Ln Unit 2212
- 200 Willow Ln Unit 2211
- 200 Willow Ln Unit 2215
- 200 Willow Ln Unit 2214