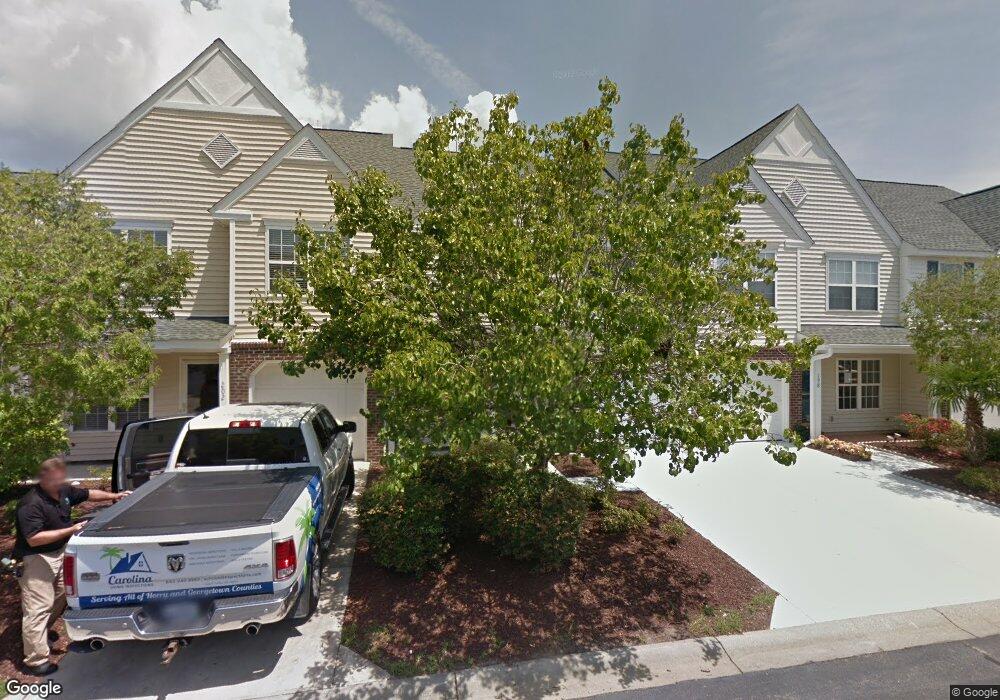
200 Wimbledon Way Murrells Inlet, SC 29576
Burgess NeighborhoodEstimated Value: $254,000 - $268,126
3
Beds
3
Baths
1,618
Sq Ft
$162/Sq Ft
Est. Value
About This Home
This home is located at 200 Wimbledon Way, Murrells Inlet, SC 29576 and is currently estimated at $262,532, approximately $162 per square foot. 200 Wimbledon Way is a home located in Horry County with nearby schools including St. James Elementary School, St. James Middle School, and St. James Intermediate.
Ownership History
Date
Name
Owned For
Owner Type
Purchase Details
Closed on
Oct 4, 2024
Sold by
Fanning Tammy D
Bought by
Lambert Tammy and Lambert Edward
Current Estimated Value
Home Financials for this Owner
Home Financials are based on the most recent Mortgage that was taken out on this home.
Original Mortgage
$140,000
Outstanding Balance
$139,475
Interest Rate
6.35%
Mortgage Type
New Conventional
Estimated Equity
$123,057
Purchase Details
Closed on
Oct 26, 2012
Sold by
Fanning Jeffrey A
Bought by
Fanning Tammy D
Purchase Details
Closed on
Sep 27, 2004
Sold by
Lutz Thomas P
Bought by
Fanning Jeffrey A and Fanning Tammy D
Home Financials for this Owner
Home Financials are based on the most recent Mortgage that was taken out on this home.
Original Mortgage
$117,900
Interest Rate
5.75%
Mortgage Type
Purchase Money Mortgage
Purchase Details
Closed on
Mar 27, 2001
Sold by
Portrait Homes Myrtle Beach Llc
Bought by
Lutz Mary S
Create a Home Valuation Report for This Property
The Home Valuation Report is an in-depth analysis detailing your home's value as well as a comparison with similar homes in the area
Home Values in the Area
Average Home Value in this Area
Purchase History
| Date | Buyer | Sale Price | Title Company |
|---|---|---|---|
| Lambert Tammy | -- | -- | |
| Fanning Tammy D | -- | -- | |
| Fanning Jeffrey A | $131,000 | -- | |
| Lutz Mary S | $139,201 | -- |
Source: Public Records
Mortgage History
| Date | Status | Borrower | Loan Amount |
|---|---|---|---|
| Open | Lambert Tammy | $140,000 | |
| Previous Owner | Fanning Jeffrey A | $117,900 |
Source: Public Records
Tax History Compared to Growth
Tax History
| Year | Tax Paid | Tax Assessment Tax Assessment Total Assessment is a certain percentage of the fair market value that is determined by local assessors to be the total taxable value of land and additions on the property. | Land | Improvement |
|---|---|---|---|---|
| 2024 | -- | $15,102 | $5,100 | $10,002 |
| 2023 | $0 | $8,149 | $1,587 | $6,562 |
| 2021 | $1,752 | $9,558 | $1,800 | $7,758 |
| 2020 | $1,662 | $9,558 | $1,800 | $7,758 |
| 2019 | $1,662 | $9,558 | $1,800 | $7,758 |
| 2018 | $1,501 | $7,086 | $1,380 | $5,706 |
| 2017 | $1,486 | $7,086 | $1,380 | $5,706 |
| 2016 | -- | $7,086 | $1,380 | $5,706 |
| 2015 | $1,486 | $7,086 | $1,380 | $5,706 |
| 2014 | $1,407 | $7,086 | $1,380 | $5,706 |
Source: Public Records
Map
Nearby Homes
- 153 Wimbledon Way
- 139 Chenoa Dr Unit D
- 119 Chenoa Dr Unit 4D
- 168 Wimbledon Way
- 326 Wembley Way Unit 326
- 927 Williston Loop Unit 927 Williston Loop a
- 931 Williston Loop
- 155 Chenoa Dr Unit D
- 160 Chenoa Dr Unit A
- 122 Parmelee Dr Unit a
- 122 Parmelee Dr Unit E
- 956 Williston Loop
- 301 Nut Hatch Ln Unit D
- 135 Parmelee Dr Unit C
- 996 Williston Loop
- 136 Parmelee Dr Unit C
- 171 Parmelee Dr Unit D
- 172 Parmelee Dr Unit D
- 140 Parmelee Dr Unit A
- 100 Parmelee Dr Unit A
- 202 Wimbledon Way
- 204 Wimbledon Way
- 198 Wimbledon Way
- 196 Wimbledon Way
- 307 Wild Rye Place Unit 307 Wild Rye Place
- 307 Wild Rye Place Unit Wynbrooke Village 1
- 307 Wild Rye Place Unit 101
- 194 Wimbledon Way
- 192 Wimbledon Way
- 157 Wimbledon Way
- 159 Wimbledon Way
- 161 Wimbledon Way
- 190 Wimbledon Way
- 163 Wimbledon Way
- 188 Wimbledon Way Unit 188 Wynebrooke Townh
- 188 Wimbledon Way
- 321 Wild Rye Place Unit 202
- 155 Wimbledon Way
- 131 Chenoa Dr
- 131 Chenoa Dr Unit 7D