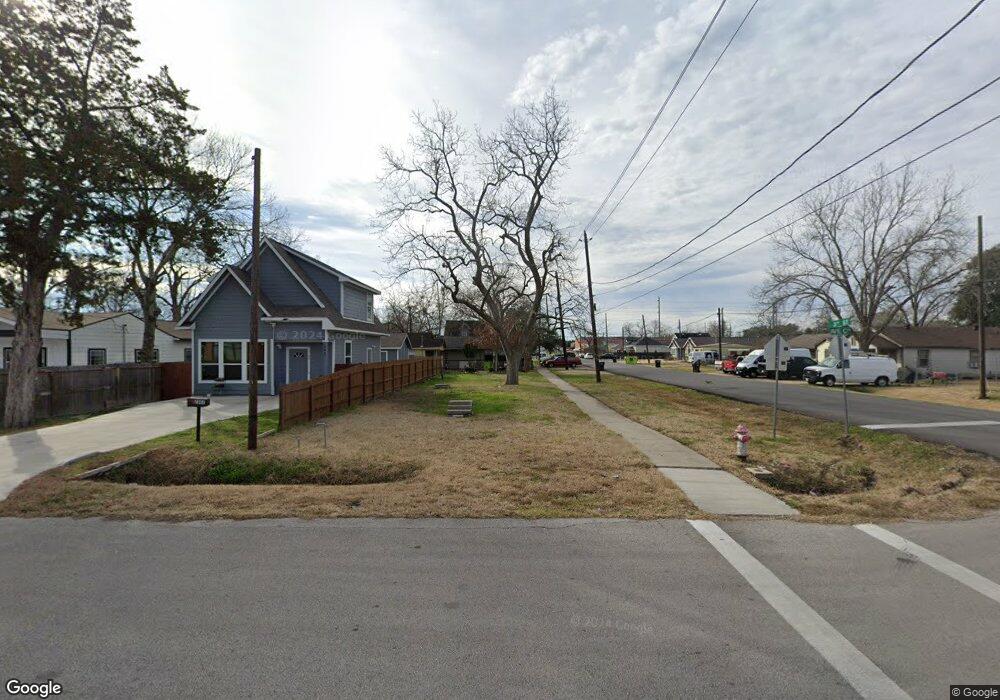
2000 Avenue C Rosenberg, TX 77471
Estimated Value: $63,582 - $256,000
2
Beds
1
Bath
530
Sq Ft
$253/Sq Ft
Est. Value
About This Home
This home is located at 2000 Avenue C, Rosenberg, TX 77471 and is currently estimated at $134,146, approximately $253 per square foot. 2000 Avenue C is a home located in Fort Bend County with nearby schools including Jackson Elementary School, George Junior High School, and B.F. Terry High School.
Ownership History
Date
Name
Owned For
Owner Type
Purchase Details
Closed on
Dec 3, 2020
Sold by
Perez Jaime and Perez Florencia Reyna
Bought by
Martinez Diana Reyna
Current Estimated Value
Purchase Details
Closed on
Nov 21, 2014
Sold by
Ramos Jose Duran and Ramos Alisia Reyna
Bought by
Perez Jaime and Perez Florencia Reyna
Purchase Details
Closed on
Jun 1, 2007
Sold by
David Darlene
Bought by
Ramos Jose Duran and Ramos Alisia Reyna
Purchase Details
Closed on
May 28, 1997
Sold by
Brooks Rosa Sanford and Brooks Leonard Edwin
Bought by
David Darlene
Create a Home Valuation Report for This Property
The Home Valuation Report is an in-depth analysis detailing your home's value as well as a comparison with similar homes in the area
Home Values in the Area
Average Home Value in this Area
Purchase History
| Date | Buyer | Sale Price | Title Company |
|---|---|---|---|
| Martinez Diana Reyna | $5,000 | None Available | |
| Perez Jaime | -- | None Available | |
| Ramos Jose Duran | -- | None Available | |
| David Darlene | -- | -- |
Source: Public Records
Tax History
| Year | Tax Paid | Tax Assessment Tax Assessment Total Assessment is a certain percentage of the fair market value that is determined by local assessors to be the total taxable value of land and additions on the property. | Land | Improvement |
|---|---|---|---|---|
| 2025 | $306 | $49,680 | $49,680 | -- |
| 2024 | $306 | $49,680 | -- | -- |
| 2023 | $261 | $13,500 | $0 | $0 |
| 2022 | $277 | $13,500 | $0 | $0 |
| 2021 | $647 | $31,180 | $13,500 | $17,680 |
| 2020 | $665 | $31,330 | $13,500 | $17,830 |
| 2019 | $707 | $30,960 | $13,500 | $17,460 |
| 2018 | $491 | $21,140 | $4,650 | $16,490 |
| 2017 | $478 | $20,500 | $4,650 | $15,850 |
| 2016 | $479 | $20,530 | $4,650 | $15,880 |
| 2015 | $485 | $20,680 | $4,650 | $16,030 |
| 2014 | $482 | $20,310 | $4,650 | $15,660 |
Source: Public Records
Map
Nearby Homes
Your Personal Tour Guide
Ask me questions while you tour the home.