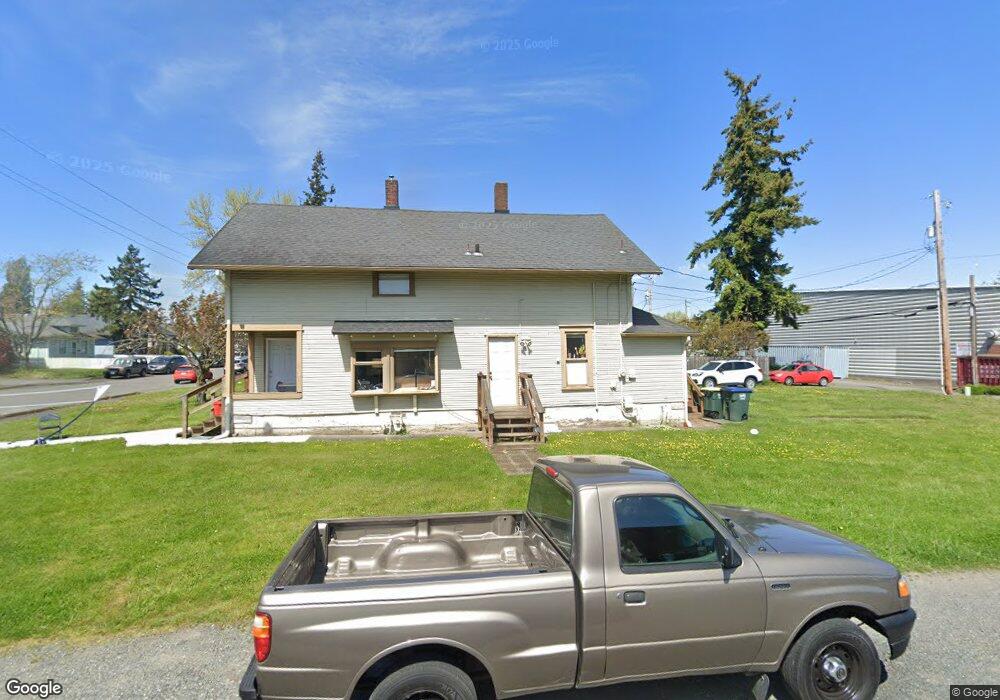
2000 Iron St Bellingham, WA 98225
Sunnyland NeighborhoodEstimated Value: $590,000 - $743,000
About This Home
Nice large house in Sunnyland neighborhood located near shopping, services, and restaurants. 1 mile to downtown Bellingham and 2.7 miles to WWU. This 5 bedroom 2 bath home features 3 main floor Bedrooms, living room, kitchen/dining area, pantry. Upper floor features 2 large bedrooms with walk in closets, a large full bath, and hallway with storage rooms. Washer and Dryer are included. Lawn care is included.
Available week of September 1, 2025.
Tenants pay all utilities. No smoking. Lawn care is included. Tenants must have renters' insurance for the lease term. Background and credit checks are performed by 3rd party screening service. Portable screening reports not accepted.
Home is currently occupied. Please do not disturb current residents. Shown by appointment.
To hold unit during the application process a holding deposit of $1073.75 is required.
To apply there is a $50 application fee - All tenants must submit applications. If income isn't 3x the rent and credit score above 600 co-signer and or additional deposits may be required. $47 co-signer fee - Co-signer must also have 600+ credit score and income that is 4x the rent.
After applications are approved the first month's rent $4295 and $200 administration are paid at lease signing.
Home Values in the Area
Average Home Value in this Area
Property History
| Date | Event | Price | List to Sale | Price per Sq Ft |
|---|---|---|---|---|
| 05/13/2025 05/13/25 | Off Market | $4,295 | -- | -- |
| 04/10/2025 04/10/25 | Price Changed | $4,295 | +7.5% | $2 / Sq Ft |
| 04/10/2025 04/10/25 | For Rent | $3,995 | -- | -- |
Tax History Compared to Growth
Tax History
| Year | Tax Paid | Tax Assessment Tax Assessment Total Assessment is a certain percentage of the fair market value that is determined by local assessors to be the total taxable value of land and additions on the property. | Land | Improvement |
|---|---|---|---|---|
| 2024 | $4,623 | $579,210 | $254,001 | $325,209 |
| 2023 | $4,623 | $593,922 | $260,453 | $333,469 |
| 2022 | $3,774 | $512,011 | $224,532 | $287,479 |
| 2021 | $3,703 | $406,358 | $178,200 | $228,158 |
| 2020 | $3,570 | $376,257 | $165,000 | $211,257 |
| 2019 | $3,196 | $350,622 | $166,370 | $184,252 |
| 2018 | $3,219 | $314,741 | $149,370 | $165,371 |
| 2017 | $2,775 | $270,981 | $128,600 | $142,381 |
| 2016 | $2,429 | $244,121 | $115,400 | $128,721 |
| 2015 | $2,381 | $222,459 | $105,400 | $117,059 |
| 2014 | -- | $211,062 | $100,000 | $111,062 |
| 2013 | -- | $208,769 | $99,750 | $109,019 |