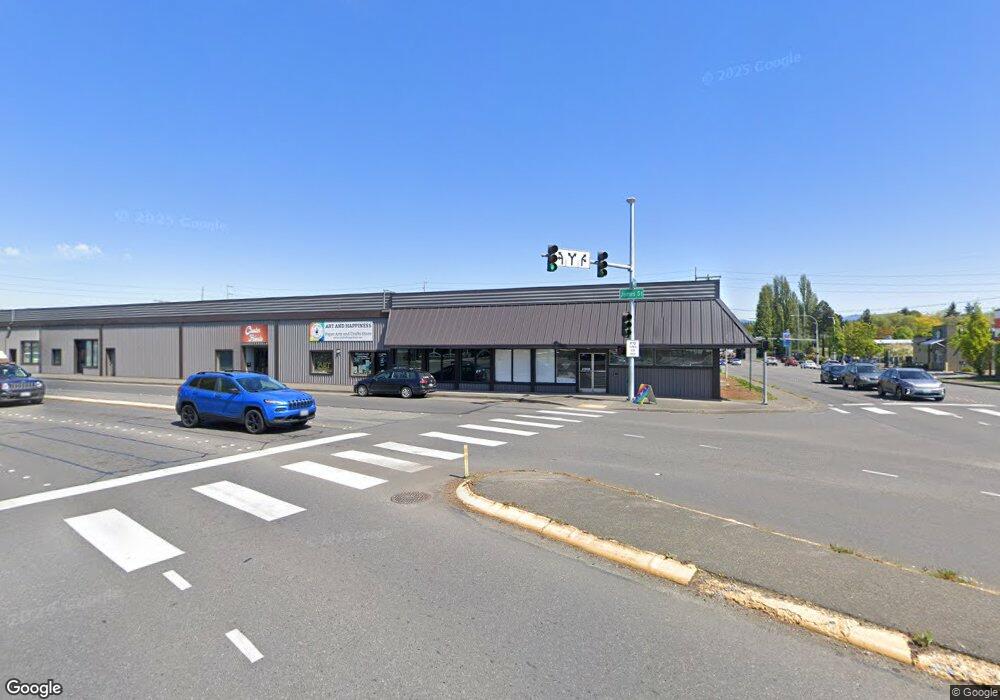
2000 James St Bellingham, WA 98225
Sunnyland NeighborhoodEstimated Value: $2,281,784
--
Bed
--
Bath
16,084
Sq Ft
$142/Sq Ft
Est. Value
About This Home
This home is located at 2000 James St, Bellingham, WA 98225 and is currently estimated at $2,281,784, approximately $141 per square foot. 2000 James St is a home located in Whatcom County with nearby schools including Sunnyland Elementary School, Whatcom Middle School, and Bellingham High School.
Ownership History
Date
Name
Owned For
Owner Type
Purchase Details
Closed on
Aug 8, 2005
Sold by
Emerald Exchange Llc
Bought by
Hardware Sales Inc
Current Estimated Value
Purchase Details
Closed on
Feb 9, 2005
Sold by
Frank & Lavon Knight Llc
Bought by
Emerald Exchange Llc
Purchase Details
Closed on
Aug 5, 2002
Sold by
Follis Kelly K and Knight Frank H
Bought by
Frank & Lavon Knight Llc
Purchase Details
Closed on
Jul 30, 2002
Sold by
Knight Frank H and Follis Kelly K
Bought by
Follis Kelly K and Knight Frank H
Create a Home Valuation Report for This Property
The Home Valuation Report is an in-depth analysis detailing your home's value as well as a comparison with similar homes in the area
Home Values in the Area
Average Home Value in this Area
Purchase History
| Date | Buyer | Sale Price | Title Company |
|---|---|---|---|
| Hardware Sales Inc | -- | -- | |
| Emerald Exchange Llc | $800,000 | Chicago Title Insurance | |
| Frank & Lavon Knight Llc | -- | -- | |
| Follis Kelly K | -- | -- | |
| Knight Frank H | -- | -- |
Source: Public Records
Tax History Compared to Growth
Tax History
| Year | Tax Paid | Tax Assessment Tax Assessment Total Assessment is a certain percentage of the fair market value that is determined by local assessors to be the total taxable value of land and additions on the property. | Land | Improvement |
|---|---|---|---|---|
| 2024 | $9,981 | $1,411,405 | $791,604 | $619,801 |
| 2023 | $9,981 | $1,283,138 | $719,664 | $563,474 |
| 2022 | $10,930 | $1,365,040 | $765,600 | $599,440 |
| 2021 | $11,582 | $1,176,759 | $660,000 | $516,759 |
| 2020 | $12,157 | $1,176,759 | $660,000 | $516,759 |
| 2019 | $10,622 | $1,193,967 | $685,400 | $508,567 |
| 2018 | $11,820 | $1,045,897 | $600,400 | $445,497 |
| 2017 | $10,320 | $995,118 | $571,250 | $423,868 |
| 2016 | $9,509 | $908,018 | $521,250 | $386,768 |
| 2015 | $9,828 | $871,000 | $500,000 | $371,000 |
| 2014 | -- | $871,000 | $500,000 | $371,000 |
| 2013 | -- | $829,275 | $475,000 | $354,275 |
Source: Public Records
Map
Nearby Homes