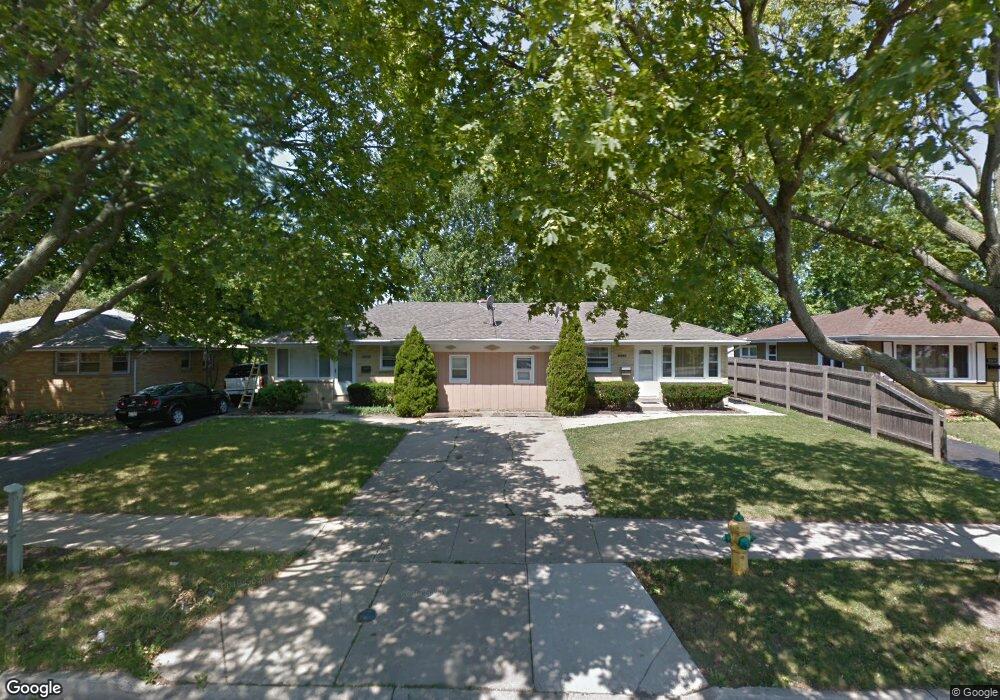
2000 Linden Ave Waukegan, IL 60087
Marquette Highlands NeighborhoodEstimated Value: $278,641 - $343,000
5
Beds
2
Baths
1,881
Sq Ft
$163/Sq Ft
Est. Value
About This Home
This home is located at 2000 Linden Ave, Waukegan, IL 60087 and is currently estimated at $306,910, approximately $163 per square foot. 2000 Linden Ave is a home located in Lake County with nearby schools including Greenwood Elementary School, Edith M Smith Middle School, and Waukegan High School.
Ownership History
Date
Name
Owned For
Owner Type
Purchase Details
Closed on
Mar 30, 2017
Sold by
Deutsche Bank National Trust Co
Bought by
Patel Vasant
Current Estimated Value
Purchase Details
Closed on
Jul 6, 2016
Sold by
Jacob Cherian
Bought by
Deutsche Bank National Trust Company
Purchase Details
Closed on
Feb 7, 2006
Sold by
Zurita Isaac
Bought by
Jacob Cherian
Home Financials for this Owner
Home Financials are based on the most recent Mortgage that was taken out on this home.
Original Mortgage
$131,250
Interest Rate
1.4%
Mortgage Type
Negative Amortization
Purchase Details
Closed on
Sep 20, 2001
Sold by
The Northern Trust Company
Bought by
Zurita Isaac
Home Financials for this Owner
Home Financials are based on the most recent Mortgage that was taken out on this home.
Original Mortgage
$152,550
Interest Rate
6.68%
Mortgage Type
FHA
Purchase Details
Closed on
Apr 26, 1995
Sold by
Hom Lai C
Bought by
Corona Deieso Don and Corona Deieso
Create a Home Valuation Report for This Property
The Home Valuation Report is an in-depth analysis detailing your home's value as well as a comparison with similar homes in the area
Home Values in the Area
Average Home Value in this Area
Purchase History
| Date | Buyer | Sale Price | Title Company |
|---|---|---|---|
| Patel Vasant | $97,844 | Attorney | |
| Deutsche Bank National Trust Company | -- | Attorney | |
| Jacob Cherian | $175,000 | Ticor | |
| Zurita Isaac | $155,000 | First American Title | |
| Corona Deieso Don | $120,000 | -- |
Source: Public Records
Mortgage History
| Date | Status | Borrower | Loan Amount |
|---|---|---|---|
| Previous Owner | Jacob Cherian | $131,250 | |
| Previous Owner | Zurita Isaac | $152,550 |
Source: Public Records
Tax History Compared to Growth
Tax History
| Year | Tax Paid | Tax Assessment Tax Assessment Total Assessment is a certain percentage of the fair market value that is determined by local assessors to be the total taxable value of land and additions on the property. | Land | Improvement |
|---|---|---|---|---|
| 2024 | $6,560 | $76,293 | $11,933 | $64,360 |
| 2023 | $6,793 | $69,571 | $10,882 | $58,689 |
| 2022 | $6,793 | $69,488 | $13,271 | $56,217 |
| 2021 | $6,497 | $62,315 | $11,839 | $50,476 |
| 2020 | $6,581 | $58,053 | $11,029 | $47,024 |
| 2019 | $6,623 | $53,196 | $10,106 | $43,090 |
| 2018 | $4,766 | $36,862 | $13,002 | $23,860 |
| 2017 | $4,639 | $32,612 | $11,503 | $21,109 |
| 2016 | $5,459 | $35,327 | $9,996 | $25,331 |
| 2015 | $5,341 | $31,619 | $8,947 | $22,672 |
| 2014 | $5,290 | $31,268 | $8,741 | $22,527 |
| 2012 | $6,556 | $33,876 | $9,471 | $24,405 |
Source: Public Records
Map
Nearby Homes
- 1905 Linden Ave
- 2232 Walnut St
- 1018 W Atlantic Ave
- 616 W Keith Ave
- 1335 Chestnut St
- 1336 N Ash St
- 1312 N Linden Ave
- 1504 W Glen Flora Ave
- 2350 N Lewis Ave
- 1105 Woodlawn Cir
- 301 W Eagle Ct
- 2008 Harding Ave
- 2009 Harding Ave
- 2207 Williamsburg Dr
- 1117 Judge Ave
- 1110 N Ash St
- 0 Traditions Dr
- 2246 Alta Vista Dr
- 2213 Alta Vista Dr
- 1000 Pine St
- 2000 N Linden Ave
- 2002 Linden Ave
- 2004 Linden Ave
- 1938 Linden Ave
- 2001 Western Ave
- 2006 Linden Ave
- 2003 Western Ave
- 2005 Western Ave
- 1930 Linden Ave
- 1005 Golf Rd
- 1105 Golf Rd
- 1941 Linden Ave
- 1937 Linden Ave
- 1926 Linden Ave
- 2007 Western Ave
- 1109 Golf Rd
- 1929 Western Ave
- 1933 Linden Ave
- 1922 Linden Ave