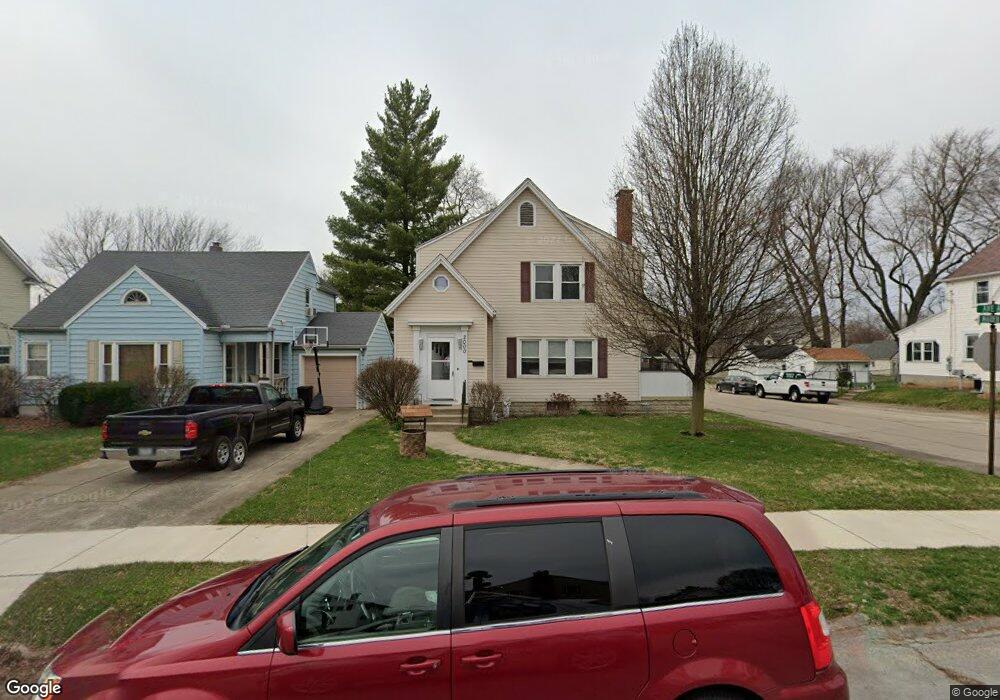
2000 Maiden Ln Springfield, OH 45504
Estimated Value: $112,000 - $196,000
3
Beds
2
Baths
1,448
Sq Ft
$109/Sq Ft
Est. Value
About This Home
This home is located at 2000 Maiden Ln, Springfield, OH 45504 and is currently estimated at $157,292, approximately $108 per square foot. 2000 Maiden Ln is a home located in Clark County with nearby schools including Snyder Park Elementary School, Roosevelt Middle School, and Springfield High School.
Ownership History
Date
Name
Owned For
Owner Type
Purchase Details
Closed on
Nov 3, 2025
Sold by
Midkiff Brandon C and Jennings Ashley L
Bought by
Jennings Ashley L
Current Estimated Value
Purchase Details
Closed on
Apr 20, 2016
Sold by
Echols Sean D and Echols Denae
Bought by
Midkiff Brandon C and Jennings Ashley L
Home Financials for this Owner
Home Financials are based on the most recent Mortgage that was taken out on this home.
Original Mortgage
$100,152
Interest Rate
3.73%
Mortgage Type
FHA
Purchase Details
Closed on
Sep 29, 2006
Sold by
Jenks Jason C
Bought by
Echols Sean D and Echols Denae
Home Financials for this Owner
Home Financials are based on the most recent Mortgage that was taken out on this home.
Original Mortgage
$79,200
Interest Rate
6.49%
Mortgage Type
Purchase Money Mortgage
Purchase Details
Closed on
Mar 1, 2006
Sold by
Raines Walter L and Raines Pamela J
Bought by
Jenks Jason C
Purchase Details
Closed on
Nov 23, 2005
Sold by
Hofbauer Lawrence J
Bought by
Raines Walter L and Raines Pamela J
Create a Home Valuation Report for This Property
The Home Valuation Report is an in-depth analysis detailing your home's value as well as a comparison with similar homes in the area
Home Values in the Area
Average Home Value in this Area
Purchase History
| Date | Buyer | Sale Price | Title Company |
|---|---|---|---|
| Jennings Ashley L | $78,000 | Servicelink | |
| Midkiff Brandon C | $102,000 | None Available | |
| Echols Sean D | $99,900 | Midwest Title Company | |
| Jenks Jason C | $85,000 | None Available | |
| Raines Walter L | $53,000 | -- |
Source: Public Records
Mortgage History
| Date | Status | Borrower | Loan Amount |
|---|---|---|---|
| Previous Owner | Midkiff Brandon C | $100,152 | |
| Previous Owner | Echols Sean D | $79,200 |
Source: Public Records
Tax History
| Year | Tax Paid | Tax Assessment Tax Assessment Total Assessment is a certain percentage of the fair market value that is determined by local assessors to be the total taxable value of land and additions on the property. | Land | Improvement |
|---|---|---|---|---|
| 2025 | $1,913 | $54,590 | $8,140 | $46,450 |
| 2024 | $1,863 | $38,660 | $7,090 | $31,570 |
| 2023 | $1,863 | $38,660 | $7,090 | $31,570 |
| 2022 | $1,908 | $38,660 | $7,090 | $31,570 |
| 2021 | $1,628 | $30,450 | $5,810 | $24,640 |
| 2020 | $1,632 | $30,450 | $5,810 | $24,640 |
| 2019 | $1,636 | $30,450 | $5,810 | $24,640 |
| 2018 | $1,430 | $25,560 | $5,540 | $20,020 |
| 2017 | $1,429 | $26,558 | $5,537 | $21,021 |
| 2016 | $1,430 | $26,558 | $5,537 | $21,021 |
| 2015 | $1,507 | $26,558 | $5,537 | $21,021 |
| 2014 | $1,500 | $26,558 | $5,537 | $21,021 |
| 2013 | $1,484 | $26,558 | $5,537 | $21,021 |
Source: Public Records
Map
Nearby Homes
- 1866 Maiden Ln
- 1715 W North St
- 1906-1908 W High St
- 106 Walter St
- 110 Walter St
- 1828 W Washington St
- 1524 W North St Unit 1526
- 40 Zischler St
- 22 Seever St
- 1915 W Washington St
- 1420 Parker Ct
- 1500 W Main St
- 202 Seever St
- 1504 W High St
- 1417 W Main St
- 366 N Isabella St
- 1618 W Pleasant St
- 1225 W High St
- 1205 W High St
- 0 Upper Valley Pike
- 2008 Maiden Ln
- 1942 Maiden Ln
- 2016 Maiden Ln
- 1938 Maiden Ln
- 2020 Maiden Ln
- 2001 Broadway St
- 2007 Broadway St
- 1965 Broadway St
- 2011 Broadway St
- 1932 Maiden Ln
- 1955 Broadway St
- 2022 Maiden Ln
- 2001 Maiden Ln
- 2009 Maiden Ln
- 0 Twp Rd 273a Unit T9505279
- 1925 Maiden Ln
- 2013 Maiden Ln
- 1951 Broadway St
- 1930 Maiden Ln
- 1919 Maiden Ln
Your Personal Tour Guide
Ask me questions while you tour the home.