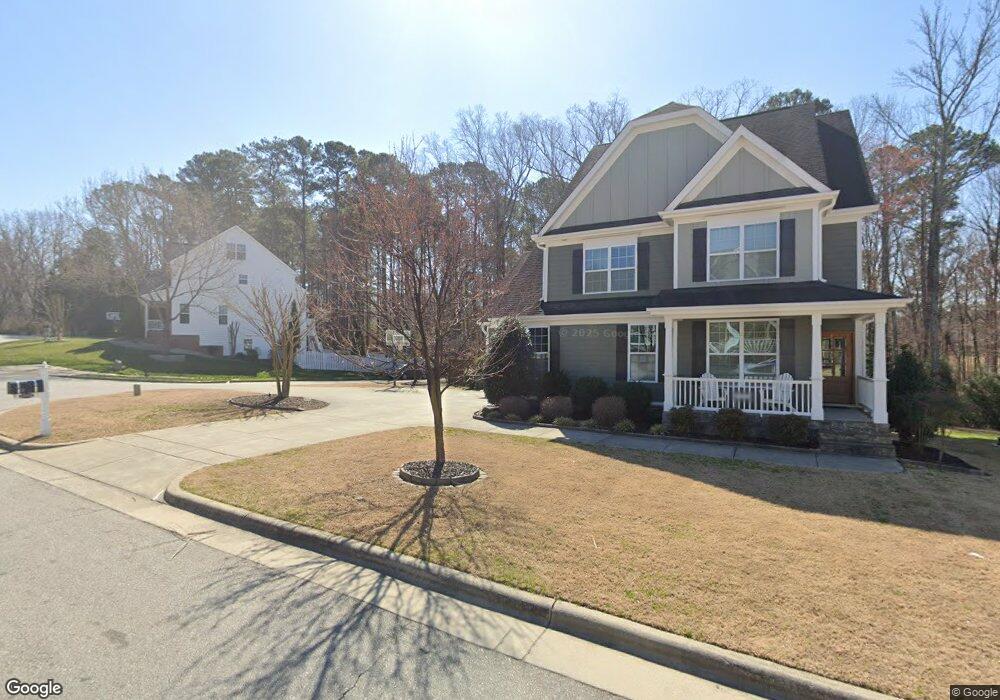
2000 Old Byre Way Apex, NC 27502
Friendship NeighborhoodEstimated Value: $727,000 - $905,000
4
Beds
3
Baths
2,575
Sq Ft
$312/Sq Ft
Est. Value
About This Home
This home is located at 2000 Old Byre Way, Apex, NC 27502 and is currently estimated at $803,375, approximately $311 per square foot. 2000 Old Byre Way is a home located in Wake County with nearby schools including Scotts Ridge Elementary School, Apex Friendship Middle School, and Apex Friendship High School.
Ownership History
Date
Name
Owned For
Owner Type
Purchase Details
Closed on
Apr 14, 2013
Sold by
Royal Oaks Buildings Group Llc
Bought by
Cowley Lauren M and Jewell Garry B
Current Estimated Value
Home Financials for this Owner
Home Financials are based on the most recent Mortgage that was taken out on this home.
Original Mortgage
$274,000
Outstanding Balance
$194,106
Interest Rate
3.55%
Mortgage Type
New Conventional
Estimated Equity
$609,269
Purchase Details
Closed on
Sep 20, 2012
Sold by
Hfp Investor Llc
Bought by
Royal Oaks Building Group Llc
Home Financials for this Owner
Home Financials are based on the most recent Mortgage that was taken out on this home.
Original Mortgage
$270,500
Interest Rate
3.63%
Mortgage Type
Future Advance Clause Open End Mortgage
Purchase Details
Closed on
Oct 21, 2010
Sold by
Reliabuilt Llc
Bought by
Hfp Investor Llc
Create a Home Valuation Report for This Property
The Home Valuation Report is an in-depth analysis detailing your home's value as well as a comparison with similar homes in the area
Home Values in the Area
Average Home Value in this Area
Purchase History
| Date | Buyer | Sale Price | Title Company |
|---|---|---|---|
| Cowley Lauren M | $343,000 | None Available | |
| Royal Oaks Building Group Llc | $154,000 | None Available | |
| Hfp Investor Llc | -- | None Available | |
| Reliabuilt Llc | $3,524,968 | None Available |
Source: Public Records
Mortgage History
| Date | Status | Borrower | Loan Amount |
|---|---|---|---|
| Open | Cowley Lauren M | $274,000 | |
| Previous Owner | Royal Oaks Building Group Llc | $270,500 |
Source: Public Records
Tax History
| Year | Tax Paid | Tax Assessment Tax Assessment Total Assessment is a certain percentage of the fair market value that is determined by local assessors to be the total taxable value of land and additions on the property. | Land | Improvement |
|---|---|---|---|---|
| 2025 | $7,096 | $810,394 | $170,000 | $640,394 |
| 2024 | $6,937 | $810,394 | $170,000 | $640,394 |
Source: Public Records
Map
Nearby Homes
- 7104 Camp Branch Ln
- 2516 Maroni Dr
- 2805 Evans Rd
- 1124 Woodlands Creek Way
- 2170 Vittorio Ln
- 2801 Evans Rd
- 3020 Holland Rd
- 2414 Vetrina Way
- 2428 Vetrina Way
- 2030 Lazio Ln
- 2429 Vetrina Way
- 1956 Lazio Ln
- 2437 Vetrina Way
- 2908 Evans Rd
- 2466 Vetrina Way
- 2061 Tordelo Place
- 2495 Vetrina Way
- 2499 Vetrina Way
- 2099 Maggie Valley Dr
- 2095 Maggie Valley Dr
- 1996 Old Byre Way
- 2006 Old Byre Way
- 1992 Old Byre Way
- 1999 Old Byre Way
- 1995 Old Byre Way
- 1991 Old Byre Way
- 1988 Old Byre Way
- 2728 Holland Rd
- 1987 Old Byre Way
- 1976 Combine Cir
- 1972 Combine Cir
- 1968 Combine Cir
- 1997 Steeple Chase Bend
- 1984 Old Byre Way
- 1983 Old Byre Way
- 1964 Combine Cir
- 1993 Steeple Chase Bend
- 1980 Old Byre Way
- 1960 Combine Cir
- 2721 Holland Rd
Your Personal Tour Guide
Ask me questions while you tour the home.