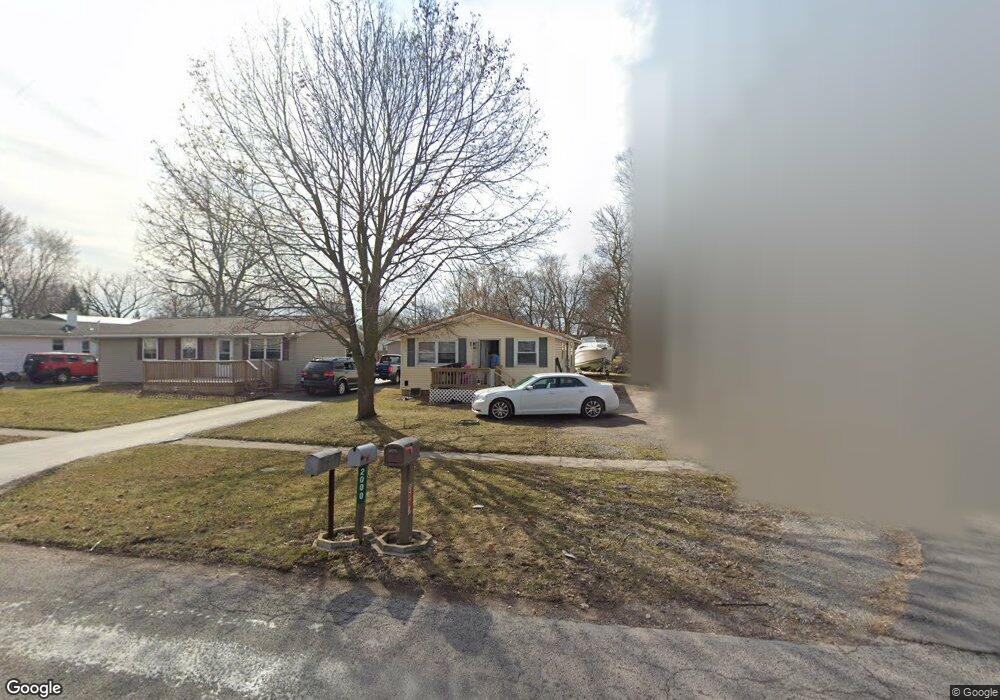
2000 Park St Findlay, OH 45840
Estimated Value: $121,260 - $155,000
3
Beds
1
Bath
960
Sq Ft
$142/Sq Ft
Est. Value
About This Home
This home is located at 2000 Park St, Findlay, OH 45840 and is currently estimated at $136,565, approximately $142 per square foot. 2000 Park St is a home located in Hancock County with nearby schools including Jefferson Elementary School, Chamberlin Hill Elementary School, and Donnell Middle School.
Ownership History
Date
Name
Owned For
Owner Type
Purchase Details
Closed on
Aug 3, 2000
Sold by
Treece William P
Bought by
Caseres Nowlhas E
Current Estimated Value
Home Financials for this Owner
Home Financials are based on the most recent Mortgage that was taken out on this home.
Original Mortgage
$51,300
Outstanding Balance
$17,525
Interest Rate
8.19%
Mortgage Type
New Conventional
Estimated Equity
$119,040
Purchase Details
Closed on
Nov 22, 1994
Sold by
Bishop Dennis
Bought by
Treece William
Home Financials for this Owner
Home Financials are based on the most recent Mortgage that was taken out on this home.
Original Mortgage
$42,842
Interest Rate
8.91%
Mortgage Type
FHA
Purchase Details
Closed on
Aug 21, 1987
Bought by
Csl Savings Bank and Bishop Janice M
Purchase Details
Closed on
May 23, 1984
Bought by
Multi Town Properties Inc
Purchase Details
Closed on
Jan 11, 1984
Bought by
Baer David L
Create a Home Valuation Report for This Property
The Home Valuation Report is an in-depth analysis detailing your home's value as well as a comparison with similar homes in the area
Home Values in the Area
Average Home Value in this Area
Purchase History
| Date | Buyer | Sale Price | Title Company |
|---|---|---|---|
| Caseres Nowlhas E | $54,000 | -- | |
| Treece William | $41,500 | -- | |
| Csl Savings Bank | -- | -- | |
| Multi Town Properties Inc | -- | -- | |
| Baer David L | -- | -- |
Source: Public Records
Mortgage History
| Date | Status | Borrower | Loan Amount |
|---|---|---|---|
| Open | Caseres Nowlhas E | $51,300 | |
| Previous Owner | Treece William | $42,842 |
Source: Public Records
Tax History
| Year | Tax Paid | Tax Assessment Tax Assessment Total Assessment is a certain percentage of the fair market value that is determined by local assessors to be the total taxable value of land and additions on the property. | Land | Improvement |
|---|---|---|---|---|
| 2024 | $964 | $26,440 | $3,900 | $22,540 |
| 2023 | $965 | $26,440 | $3,900 | $22,540 |
| 2022 | $962 | $26,440 | $3,900 | $22,540 |
| 2021 | $878 | $21,010 | $3,640 | $17,370 |
| 2020 | $877 | $21,010 | $3,640 | $17,370 |
| 2019 | $860 | $21,010 | $3,640 | $17,370 |
| 2018 | $817 | $18,270 | $3,170 | $15,100 |
| 2017 | $408 | $18,270 | $3,170 | $15,100 |
| 2016 | $816 | $18,270 | $3,170 | $15,100 |
| 2015 | $767 | $17,060 | $2,380 | $14,680 |
| 2014 | $767 | $17,060 | $2,380 | $14,680 |
| 2012 | $776 | $17,060 | $2,380 | $14,680 |
Source: Public Records
Map
Nearby Homes
- 209 E Hobart Ave
- 400 E Pearl St
- 242 E Yates Ave
- 136 E Hobart Ave
- 315 Fairlawn Place
- 731 5th St
- 206 Greenlawn Ave
- 1726 Eastview Dr
- 123 Glendale Ave
- 1304 Douglas Pkwy
- 324 W Mcpherson Ave
- 3001 Goldenrod Ln
- 1100 Stall Dr
- 216 1st St
- 10692 Cherokee Dr
- 1113 Hurd Ave
- 2925 Goldenrod Ln
- 0 Township Road 227
- 865 S Main St
- 0 Viburnum Ct Unit 10002881
- 2004 Park St
- 1930 Park St
- 2008 Park St
- 2012 Park St
- 2001 Washington Ave
- 1916 Park St
- 2016 Park St
- 2003 Washington Ave
- 1915 Washington Ave
- 2007 Washington Ave
- 2011 Washington Ave
- 1912 Park St
- 2018 Park St
- 2001 Park St
- 2005 Park St
- 1911 Washington Ave
- 1931 Park St
- 2015 Washington Ave
- 1925 Park St
- 1909 Washington Ave
Your Personal Tour Guide
Ask me questions while you tour the home.