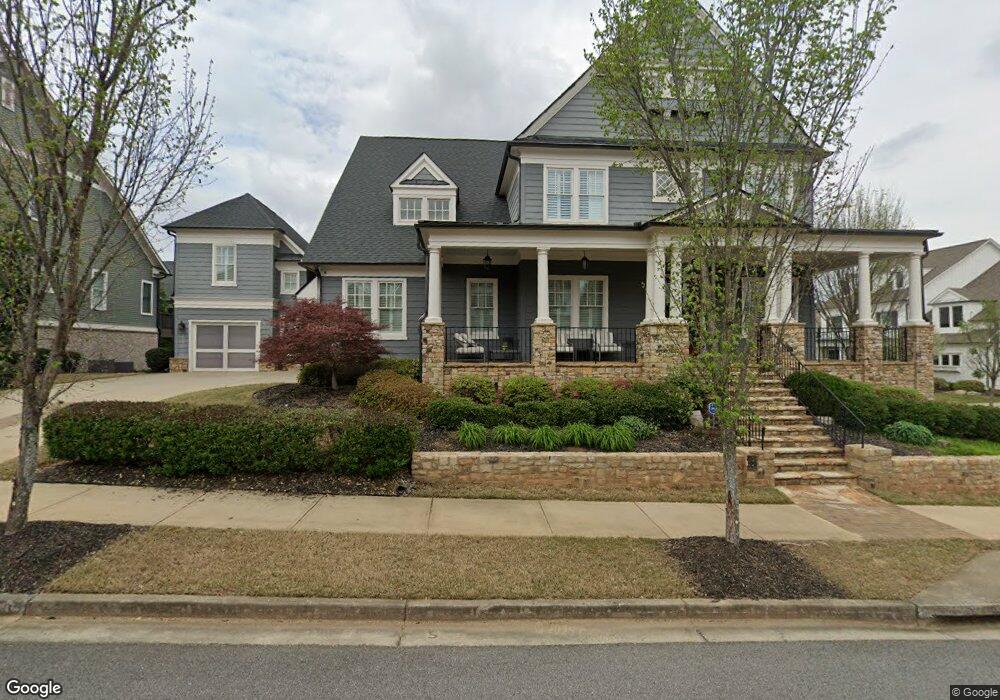
2000 Sauls Place Alpharetta, GA 30004
Estimated Value: $1,511,216 - $1,827,000
5
Beds
5
Baths
4,526
Sq Ft
$377/Sq Ft
Est. Value
About This Home
This home is located at 2000 Sauls Place, Alpharetta, GA 30004 and is currently estimated at $1,704,054, approximately $376 per square foot. 2000 Sauls Place is a home with nearby schools including Crabapple Crossing Elementary School, Northwestern Middle School, and Milton High School.
Ownership History
Date
Name
Owned For
Owner Type
Purchase Details
Closed on
Apr 22, 2025
Sold by
Mauck James Leonard
Bought by
Mauck Family Trust and Mauck James Leonard Jr Tr
Current Estimated Value
Home Financials for this Owner
Home Financials are based on the most recent Mortgage that was taken out on this home.
Original Mortgage
$1,409,600
Outstanding Balance
$1,403,343
Interest Rate
6.65%
Mortgage Type
New Conventional
Estimated Equity
$300,711
Purchase Details
Closed on
Oct 26, 2016
Sold by
Ian R
Bought by
Stuttard Ian R and Stuttard Teresa
Purchase Details
Closed on
May 27, 2015
Sold by
Ashton Atlanta Residential Llc
Bought by
Barber Craig A and Tsoi Ol
Home Financials for this Owner
Home Financials are based on the most recent Mortgage that was taken out on this home.
Original Mortgage
$691,069
Interest Rate
3.79%
Mortgage Type
New Conventional
Create a Home Valuation Report for This Property
The Home Valuation Report is an in-depth analysis detailing your home's value as well as a comparison with similar homes in the area
Home Values in the Area
Average Home Value in this Area
Purchase History
| Date | Buyer | Sale Price | Title Company |
|---|---|---|---|
| Mauck Family Trust | -- | -- | |
| Mauck James Leonard | $1,762,000 | -- | |
| Stuttard Ian R | -- | -- | |
| Stuttard Ian R | $780,272 | -- | |
| Barber Craig A | $863,837 | -- |
Source: Public Records
Mortgage History
| Date | Status | Borrower | Loan Amount |
|---|---|---|---|
| Open | Mauck Family Trust | $1,409,600 | |
| Previous Owner | Barber Craig A | $691,069 |
Source: Public Records
Tax History Compared to Growth
Tax History
| Year | Tax Paid | Tax Assessment Tax Assessment Total Assessment is a certain percentage of the fair market value that is determined by local assessors to be the total taxable value of land and additions on the property. | Land | Improvement |
|---|---|---|---|---|
| 2025 | $1,732 | $516,560 | $108,600 | $407,960 |
| 2023 | $1,732 | $492,160 | $63,680 | $428,480 |
| 2022 | $9,259 | $408,120 | $55,440 | $352,680 |
| 2021 | $8,537 | $326,280 | $58,000 | $268,280 |
| 2020 | $9,154 | $346,560 | $45,200 | $301,360 |
| 2019 | $1,665 | $326,400 | $83,840 | $242,560 |
| 2018 | $8,656 | $318,760 | $81,880 | $236,880 |
| 2017 | $9,732 | $345,520 | $57,480 | $288,040 |
| 2016 | $9,733 | $345,520 | $57,480 | $288,040 |
| 2015 | $4,324 | $127,040 | $45,560 | $81,480 |
| 2014 | -- | $42,240 | $42,240 | $0 |
Source: Public Records
Map
Nearby Homes
- 143 Nakomis Place
- 257 Lask Ln
- 249 Lask Ln
- 13015 Morningpark Cir Unit 1
- 13025 Morningpark Cir
- 245 Lask Ln
- 237 Lask Ln
- 507 Branyan Trail
- 233 Lask Ln
- 13125 Morningpark Cir
- 216 Lask Ln
- 12842 Waterside Dr Unit 2
- 12857 Waterside Dr
- 1950 Heritage Walk
- 85 Arabian Ave Unit 2
- 580 Stillhouse Ln Unit 2
- 666 Abbey Ct
- 12440 Brookhill Crossing Ln
- 137 Quinn Way
- 113 Quinn Way
- 0 Nakomis Place Unit 8808077
- 0 Nakomis Place Unit 8614365
- 0 Nakomis Place Unit 7599439
- 0 Nakomis Place Unit 8847624
- 0 Nakomis Place Unit 7385999
- 0 Nakomis Place
- 147 Nakomis Place
- 2020 Sauls Place
- 2025 Sauls Place
- 151 Nakomis Place
- 3025 Evelyn Ln
- 2040 Sauls Place
- 0 Evelyn Ln Unit 7615637
- 0 Evelyn Ln
- 155 Nakomis Place
- 1000 Lee St
- 1000 Lee St
- 2045 Sauls Place
- 3045 Evelyn
- 3045 Evelyn Ln