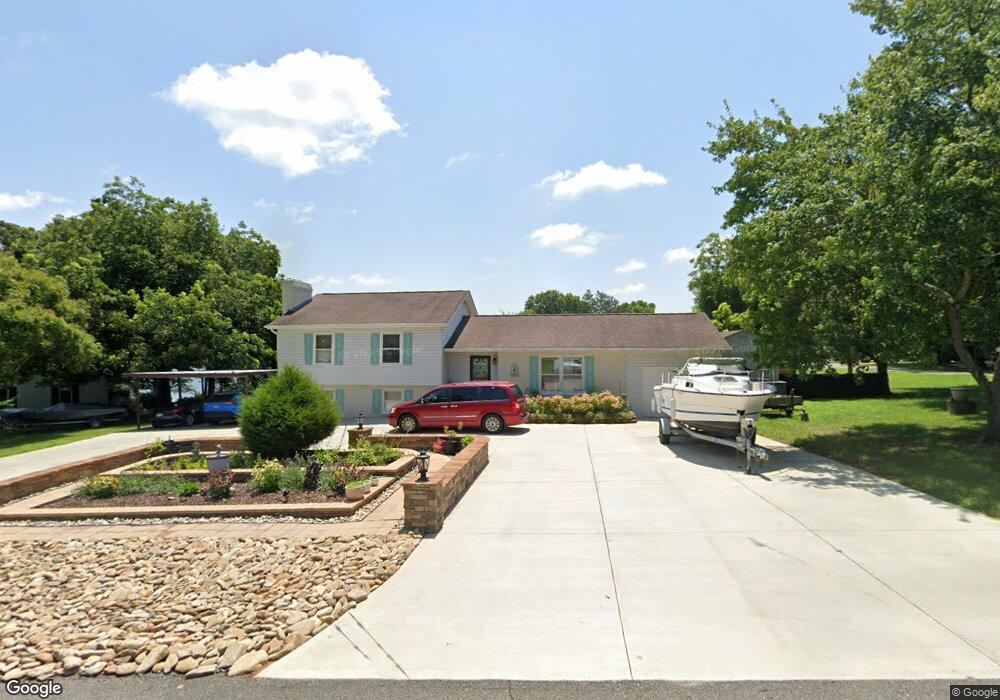
2000 Stoneview Ct Shelby, NC 28150
Estimated Value: $439,000 - $550,156
4
Beds
3
Baths
1,964
Sq Ft
$245/Sq Ft
Est. Value
About This Home
This home is located at 2000 Stoneview Ct, Shelby, NC 28150 and is currently estimated at $480,539, approximately $244 per square foot. 2000 Stoneview Ct is a home located in Cleveland County with nearby schools including Shelby Middle School, Shelby High School, and Pinnacle Classical Academy.
Ownership History
Date
Name
Owned For
Owner Type
Purchase Details
Closed on
Jun 20, 2006
Sold by
Bivins Temolly L and Bivins Beth P
Bought by
Allen Douglan Wealey
Current Estimated Value
Create a Home Valuation Report for This Property
The Home Valuation Report is an in-depth analysis detailing your home's value as well as a comparison with similar homes in the area
Home Values in the Area
Average Home Value in this Area
Purchase History
| Date | Buyer | Sale Price | Title Company |
|---|---|---|---|
| Allen Douglan Wealey | $210,000 | None Available |
Source: Public Records
Tax History
| Year | Tax Paid | Tax Assessment Tax Assessment Total Assessment is a certain percentage of the fair market value that is determined by local assessors to be the total taxable value of land and additions on the property. | Land | Improvement |
|---|---|---|---|---|
| 2025 | $2,771 | $436,426 | $145,350 | $291,076 |
| 2024 | $2,459 | $306,119 | $144,400 | $161,719 |
| 2023 | $2,446 | $306,119 | $144,400 | $161,719 |
| 2022 | $2,446 | $306,119 | $144,400 | $161,719 |
| 2021 | $2,326 | $282,738 | $144,400 | $138,338 |
| 2020 | $1,967 | $228,848 | $122,740 | $106,108 |
| 2019 | $1,967 | $228,848 | $122,740 | $106,108 |
| 2018 | $1,963 | $228,848 | $122,740 | $106,108 |
| 2017 | $1,953 | $228,848 | $122,740 | $106,108 |
| 2016 | $1,870 | $228,848 | $122,740 | $106,108 |
| 2015 | $1,517 | $184,178 | $80,322 | $103,856 |
| 2014 | $1,517 | $184,178 | $80,322 | $103,856 |
Source: Public Records
Map
Nearby Homes
- 2200 Holly Ln
- 2021 Dogwood Trail
- 2315 Marlowe Ave
- 2305 Holly Ln
- 2111 Windermere Ln
- 526 Borders Rd
- 2207 Peninsula Ave
- 2320 China Ave
- 2816 Wilkshire Dr
- 2404 Eleanor Dr
- 32 Heritage Ln
- 357 Preyer St
- 1813 Isaac Place
- 313 Kellom Dr
- 0 Oates Dr
- 1237 New Crest Ln
- 1906 Rucker Rd
- 220 Nancy Dr
- 113 Quail Hollow Dr
- 108 Three Oaks Ln
- 810 Borders Rd
- 2050 Stoneview Ct
- 808 Borders Rd
- 2060 Stoneview Ct
- 19 Borders Rd
- 2064 Stoneview Ct
- 2068 Stoneview Ct
- 807 Borders Rd
- 807 Borders Rd Unit 4
- 817 Borders Rd
- 804 Borders Rd
- 107 Thisa Way
- 819 Borders Rd
- 105 Thisa Way
- 803 Borders Rd
- 103 Thisa Way
- 902 Borders Rd
- 2526 Wildwood Dr
- 901 Borders Rd
- 2524 Wildwood Dr
Your Personal Tour Guide
Ask me questions while you tour the home.