
Seller's Agent in 2024
Cameron DeAngelo
All Vegas Valley Realty
(702) 496-2121
3 in this area
84 Total Sales
Estimated Value: $492,000 - $538,000
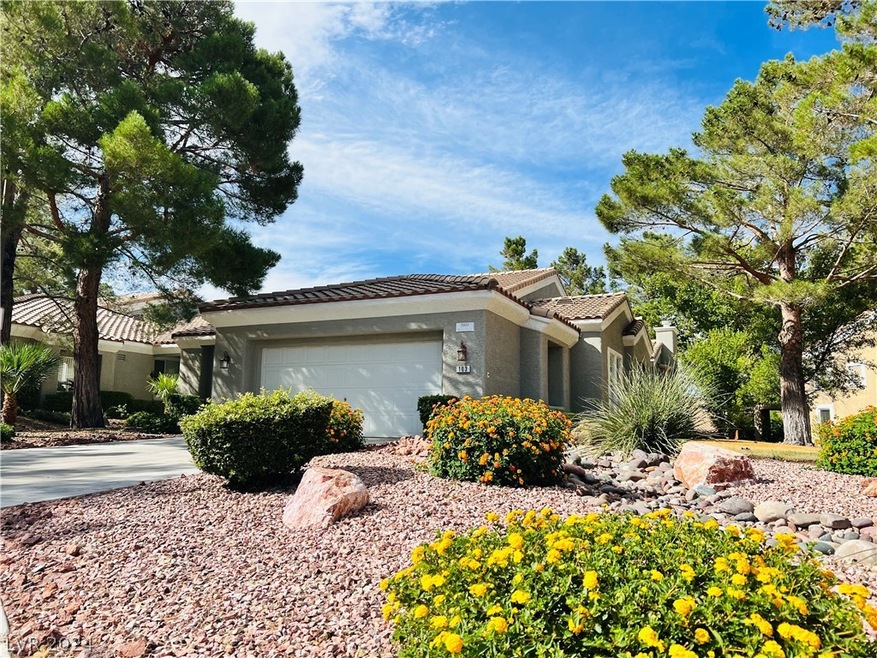
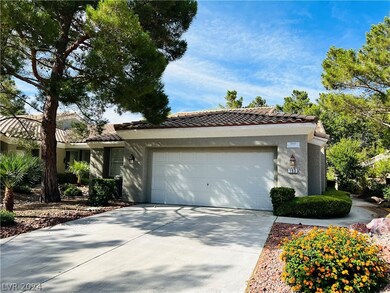
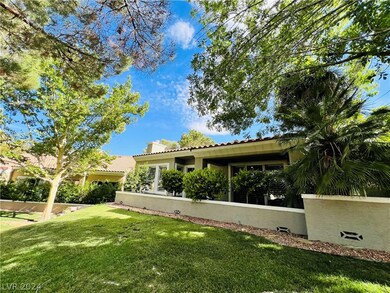
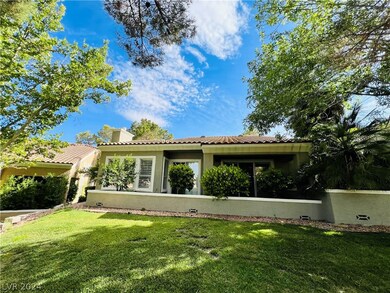
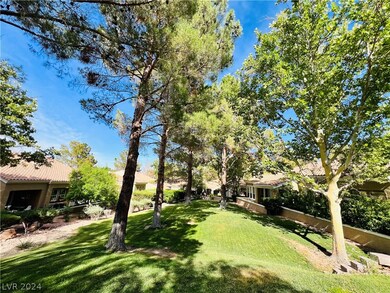
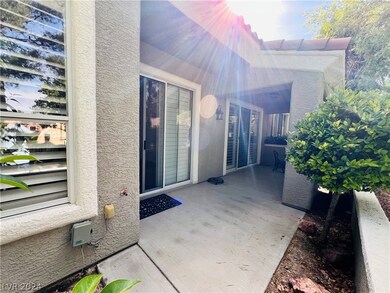
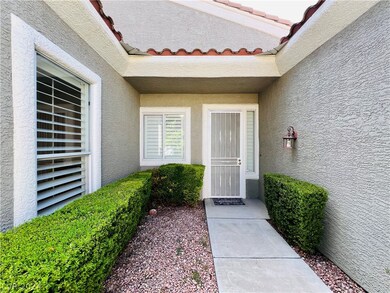
WOW what a Townhouse this is! Don't miss this Amazing Summerlin Community. 2 bedroom, 2.5 bath, 2000+ sq. ft. Single story. Spacious floor plan, Plantation Shutters throughout. Gas fireplace in Living room. Large kitchen, granite counter tops, pull out shelves, built in oven/microwave, gas cooktop. Bedroom each have dedicated bathrooms and are separate. Two car garage and more.
Last Agent to Rent the Property
Specialists Property Managemen Brokerage Phone: 702-888-1395 License #B.0145007 Listed on: 06/19/2024
Last Renter's Agent
Specialists Property Managemen Brokerage Phone: 702-888-1395 License #B.0145007 Listed on: 06/19/2024
| Date | Buyer | Sale Price | Title Company |
|---|---|---|---|
| Diane Cardall Nau Living Trust | $475,000 | Chicago Title | |
| Nix Louise M | -- | -- | |
| Nix Louise M | $184,500 | United Title |
| Date | Event | Price | Change | Sq Ft Price |
|---|---|---|---|---|
| 07/01/2024 07/01/24 | Rented | $2,790 | 0.0% | -- |
| 06/19/2024 06/19/24 | For Rent | $2,790 | 0.0% | -- |
| 05/14/2024 05/14/24 | Sold | $475,000 | -4.0% | $232 / Sq Ft |
| 05/03/2024 05/03/24 | Pending | -- | -- | -- |
| 04/13/2024 04/13/24 | Price Changed | $495,000 | -0.1% | $242 / Sq Ft |
| 03/13/2024 03/13/24 | Price Changed | $495,490 | 0.0% | $242 / Sq Ft |
| 02/25/2024 02/25/24 | Price Changed | $495,495 | 0.0% | $242 / Sq Ft |
| 02/23/2024 02/23/24 | Price Changed | $495,500 | +0.1% | $242 / Sq Ft |
| 01/09/2024 01/09/24 | For Sale | $495,000 | -- | $242 / Sq Ft |
| Year | Tax Paid | Tax Assessment Tax Assessment Total Assessment is a certain percentage of the fair market value that is determined by local assessors to be the total taxable value of land and additions on the property. | Land | Improvement |
|---|---|---|---|---|
| 2025 | $2,484 | $131,948 | $45,150 | $86,798 |
| 2024 | $2,301 | $131,948 | $45,150 | $86,798 |
| 2023 | $2,301 | $128,947 | $49,350 | $79,597 |
| 2022 | $2,234 | $119,906 | $44,100 | $75,806 |
| 2021 | $2,169 | $103,080 | $41,300 | $61,780 |
| 2020 | $2,103 | $101,135 | $36,400 | $64,735 |
| 2019 | $2,041 | $97,661 | $33,250 | $64,411 |
| 2018 | $1,982 | $79,546 | $19,250 | $60,296 |
| 2017 | $2,588 | $78,768 | $18,550 | $60,218 |
| 2016 | $1,877 | $76,332 | $14,700 | $61,632 |
| 2015 | $1,873 | $66,629 | $13,650 | $52,979 |
| 2014 | $1,818 | $53,745 | $12,250 | $41,495 |
Seller's Agent in 2024
Cameron DeAngelo
All Vegas Valley Realty
(702) 496-2121
3 in this area
84 Total Sales
Landlord's Agent in 2024
Admin Assistant
Specialists Property Managemen
(702) 888-1395
5 in this area
48 Total Sales
N
Buyer's Agent in 2024
Noreen Lane
IS Luxury
(702) 423-9449
3 in this area
12 Total Sales
Source: Las Vegas REALTORS®
MLS Number: 2593106
APN: 137-24-614-021
Disclaimer: Certain information contained herein is derived from information provided by parties other than Homes.com. All information provided is deemed reliable, but is not guaranteed to be accurate and should be independently verified.
![]() The data relating to real estate for sale on this web site comes in part from the INTERNET DATA EXCHANGE Program of the Greater Las Vegas Association of REALTORS® MLS. Real estate listings held by brokerage firms other than this site owner are marked with the IDX logo. Information is deemed reliable but not guaranteed. Copyright 2025 of the Greater Las Vegas Association of REALTORS® MLS. All rights reserved.
The data relating to real estate for sale on this web site comes in part from the INTERNET DATA EXCHANGE Program of the Greater Las Vegas Association of REALTORS® MLS. Real estate listings held by brokerage firms other than this site owner are marked with the IDX logo. Information is deemed reliable but not guaranteed. Copyright 2025 of the Greater Las Vegas Association of REALTORS® MLS. All rights reserved.