2000 Trotters Ridge Way Unit 2B Roswell, GA 30075
Estimated payment $4,208/month
Highlights
- Separate his and hers bathrooms
- View of Trees or Woods
- Traditional Architecture
- Mountain Park Elementary School Rated A
- Clubhouse
- Wood Flooring
About This Home
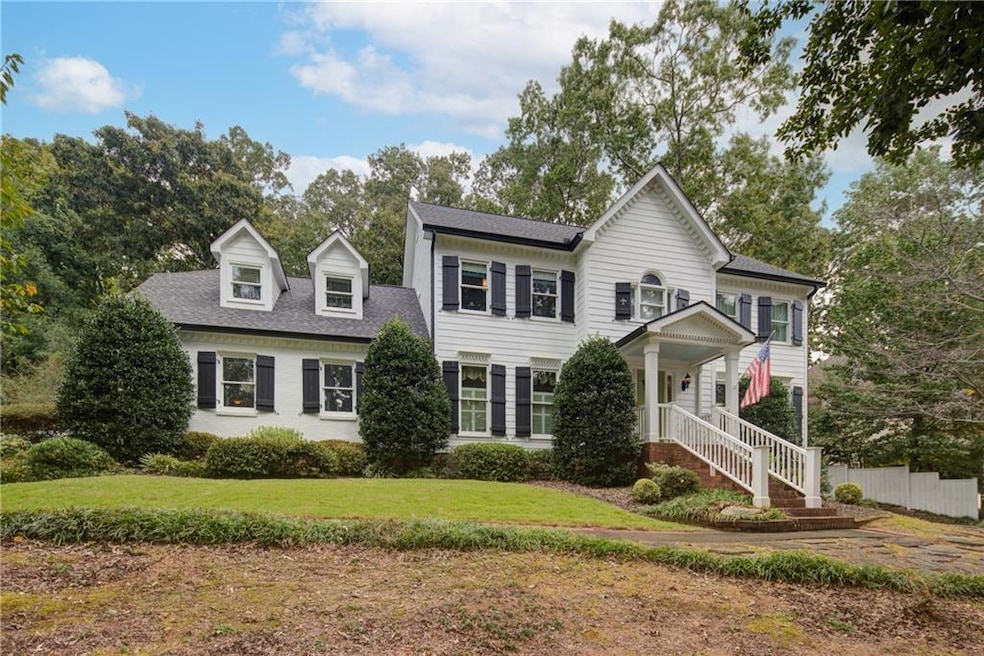
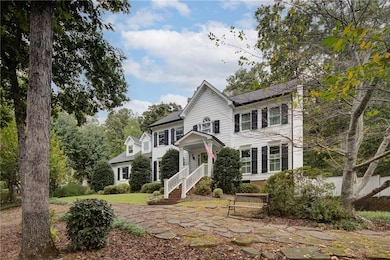
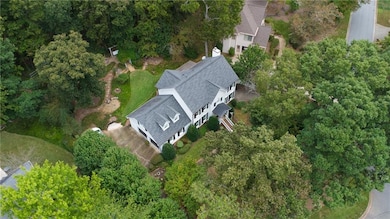
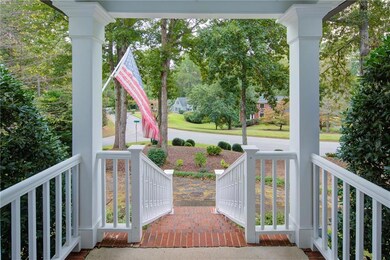
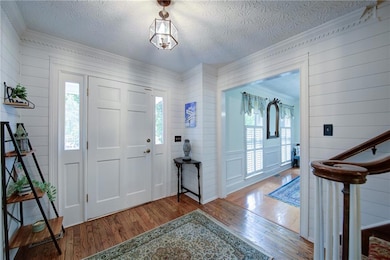
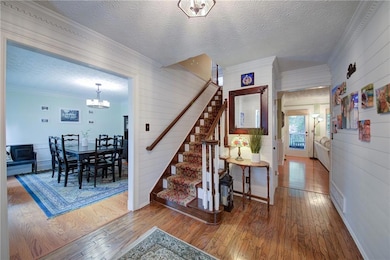
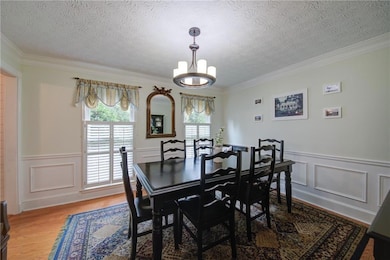
Stunning Traditional Home in Prime Roswell Location! Being able to reach key spots like Mountain Park Elementary, Publix and Target without having to deal with traffic on Route 92 is a real perk! Nestled on a fabulous corner lot, this home offers timeless curb appeal and a beautifully landscaped, private backyard. Located in one of Roswell's most sought-after areas, you'll be close to everything while enjoying your own serene retreat. Step inside to find a spacious layout with a formal dining room, formal living room (or optional office), and a large family room complete with a cozy fireplace. A wonderful oversized screened porch extends your living space and is perfect for entertaining. Upstairs features three bedrooms, two and a half baths, plus a huge bonus room that can serve as a second family room, media room, or expansive office. This home offers the convenience of a staircase in the front foyer as well as a staircase off the kitchen to reach the second floor! The full basement is smartly divided - one side ready for finishing and the other with a third garage door and potential workshop space. This rare traditional gem combines classic character with modern conveniences, offering both charm and flexibility for today's lifestyle.
Home Details
Home Type
- Single Family
Est. Annual Taxes
- $3,733
Year Built
- Built in 1985
Lot Details
- 0.49 Acre Lot
- Private Entrance
- Landscaped
- Corner Lot
- Private Yard
- Back and Front Yard
HOA Fees
- $83 Monthly HOA Fees
Parking
- 3 Car Attached Garage
- Parking Accessed On Kitchen Level
- Side Facing Garage
- Driveway
Home Design
- Traditional Architecture
- Shingle Roof
- Composition Roof
- Concrete Perimeter Foundation
- HardiePlank Type
Interior Spaces
- 2-Story Property
- Central Vacuum
- Rear Stairs
- Bookcases
- Ceiling Fan
- Gas Log Fireplace
- Entrance Foyer
- Living Room with Fireplace
- Formal Dining Room
- Home Office
- Bonus Room
- Screened Porch
- Views of Woods
- Unfinished Basement
- Basement Fills Entire Space Under The House
- Fire and Smoke Detector
Kitchen
- Eat-In Kitchen
- Breakfast Bar
- Self-Cleaning Oven
- Gas Range
- Range Hood
- Microwave
- Dishwasher
- Stone Countertops
- White Kitchen Cabinets
Flooring
- Wood
- Carpet
- Laminate
- Ceramic Tile
Bedrooms and Bathrooms
- 4 Bedrooms
- Walk-In Closet
- Separate his and hers bathrooms
- Double Vanity
- Separate Shower in Primary Bathroom
- Soaking Tub
Laundry
- Laundry Room
- Laundry on main level
- Sink Near Laundry
Outdoor Features
- Rain Gutters
Schools
- Mountain Park - Fulton Elementary School
- Crabapple Middle School
- Roswell High School
Utilities
- Central Air
- Heating System Uses Natural Gas
- High Speed Internet
- Cable TV Available
Listing and Financial Details
- Legal Lot and Block 26 / D
- Assessor Parcel Number 12 135300380127
Community Details
Overview
- $1,000 Initiation Fee
- Highland Colony HOA, Phone Number (770) 517-1761
- Highland Colony Subdivision
Amenities
- Clubhouse
Recreation
- Tennis Courts
- Community Playground
- Community Pool
Map
Home Values in the Area
Average Home Value in this Area
Tax History
| Year | Tax Paid | Tax Assessment Tax Assessment Total Assessment is a certain percentage of the fair market value that is determined by local assessors to be the total taxable value of land and additions on the property. | Land | Improvement |
|---|---|---|---|---|
| 2025 | $779 | $241,960 | $70,080 | $171,880 |
| 2023 | $779 | $171,600 | $35,800 | $135,800 |
| 2022 | $3,526 | $171,600 | $35,800 | $135,800 |
| 2021 | $4,632 | $145,440 | $29,200 | $116,240 |
| 2020 | $4,611 | $140,800 | $38,840 | $101,960 |
| 2019 | $685 | $138,320 | $38,160 | $100,160 |
| 2018 | $3,554 | $125,920 | $37,280 | $88,640 |
| 2017 | $3,326 | $114,000 | $35,840 | $78,160 |
| 2016 | $3,327 | $114,000 | $35,840 | $78,160 |
| 2015 | $3,492 | $121,080 | $35,840 | $85,240 |
| 2014 | $3,080 | $100,480 | $32,680 | $67,800 |
Property History
| Date | Event | Price | List to Sale | Price per Sq Ft |
|---|---|---|---|---|
| 10/08/2025 10/08/25 | For Sale | $725,000 | -- | $276 / Sq Ft |
Purchase History
| Date | Type | Sale Price | Title Company |
|---|---|---|---|
| Warranty Deed | -- | -- | |
| Deed | $302,000 | -- |
Mortgage History
| Date | Status | Loan Amount | Loan Type |
|---|---|---|---|
| Open | $176,000 | New Conventional | |
| Previous Owner | $190,000 | New Conventional |
Source: First Multiple Listing Service (FMLS)
MLS Number: 7657688
APN: 12-1353-0038-012-7
Disclaimer: Certain information contained herein is derived from information provided by parties other than Homes.com. All information provided is deemed reliable, but is not guaranteed to be accurate and should be independently verified.
![]() Listings identified with the FMLS IDX logo come from FMLS and are held by brokerage firms other than the owner of this website. The listing brokerage is identified in any listing details. Information is deemed reliable but is not guaranteed. If you believe any FMLS listing contains material that infringes your copyrighted work please visit www.fmls.com/dmca to review our DMCA policy and learn how to submit a takedown request. © 2025 First Multiple Listing Service, Inc.
Listings identified with the FMLS IDX logo come from FMLS and are held by brokerage firms other than the owner of this website. The listing brokerage is identified in any listing details. Information is deemed reliable but is not guaranteed. If you believe any FMLS listing contains material that infringes your copyrighted work please visit www.fmls.com/dmca to review our DMCA policy and learn how to submit a takedown request. © 2025 First Multiple Listing Service, Inc.
- 4973 Gunners Pass NE
- 1820 Azalea Springs Trail
- 11790 Highland Colony Dr
- 11775 Highland Colony Dr Unit 1
- 1945 Ledieu Rd
- 4383 Capstone Ct NE
- 235 Foxley Way
- 715 Winterwind Way
- 150 Flowing Spring Trail Unit 4
- 230 Moss Stone Way Unit 2
- 4304 Lindsey Way NE
- 475 Laurian View Ct
- 5023 Gunners Run NE
- 12180 Lonsdale Ln
- 989 Wiley Bridge Rd
- 123 Ivey Way
- 243 Witter Way
- 793 Cardinal Cove
- 7605 Lowery Oak Dr
- 307 Paxton Ct
- 3747 Running Fox Dr
- 1601 Willow Way
- 1580 Jones Rd Unit Cottage 1
- 1273 W Wylie Bridge Rd
- 3980 Rock Mill Pkwy
- 265 Shady Marsh Trail Unit B
- 585 W Crossville Rd
- 10565 Shallowford Rd
- 3345 Holliglen Dr
- 315 Dexter Dr
- 3450 Ellenwood Ct NE
- 319 Dexter Dr
- 3765 Cochran Lake Dr
- 425 Monivea Ln
- 1412 River Landing Way
- 315 Hardscrabble Rd
