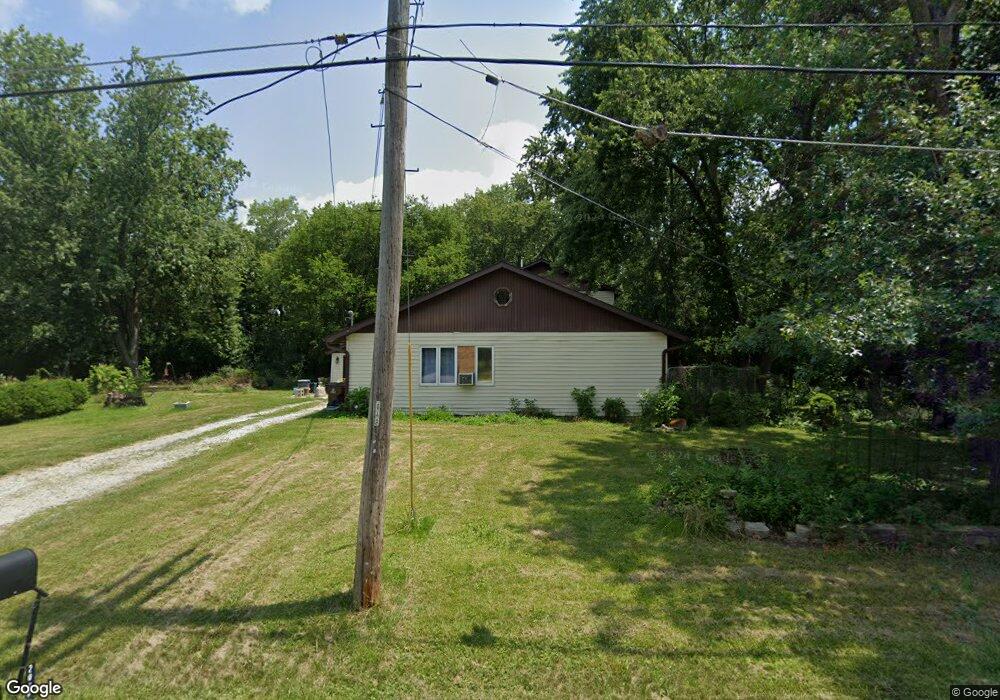
20001 Keystone Ave Matteson, IL 60443
Old Matteson NeighborhoodEstimated Value: $117,000 - $131,000
2
Beds
1
Bath
949
Sq Ft
$133/Sq Ft
Est. Value
About This Home
This home is located at 20001 Keystone Ave, Matteson, IL 60443 and is currently estimated at $126,000, approximately $132 per square foot. 20001 Keystone Ave is a home located in Cook County with nearby schools including Illinois School, Arcadia Elementary School, and Indiana Elementary School.
Ownership History
Date
Name
Owned For
Owner Type
Purchase Details
Closed on
Jan 24, 2020
Sold by
Dormun Alphonso
Bought by
V O T Properties Llc
Current Estimated Value
Purchase Details
Closed on
Oct 23, 2019
Sold by
V O T Properties Llc
Bought by
Dormun Alphonso
Purchase Details
Closed on
Sep 20, 2019
Sold by
Black Kendra
Bought by
V O T Properties Llc
Purchase Details
Closed on
Aug 27, 2018
Sold by
Groundfloor Properties Ga Llc
Bought by
Black Kendra
Purchase Details
Closed on
Apr 10, 2018
Sold by
Jones Asset Management Llc
Bought by
Groundfloor Properties Ga Llc
Purchase Details
Closed on
Jun 9, 2015
Sold by
Campbell William C
Bought by
Jones Asset Management Llc
Purchase Details
Closed on
Mar 6, 2015
Sold by
Arbanas Michael B
Bought by
Arbanas Worldwide Llc
Purchase Details
Closed on
Dec 8, 2014
Sold by
Pnc Bank National Association
Bought by
Arbanas Michael B
Home Financials for this Owner
Home Financials are based on the most recent Mortgage that was taken out on this home.
Original Mortgage
$408,000
Interest Rate
4.25%
Mortgage Type
Commercial
Purchase Details
Closed on
Jun 21, 2013
Sold by
Secretary Of Hud
Bought by
Campbell William
Purchase Details
Closed on
Mar 13, 2012
Sold by
Lassiter Catherine M
Bought by
Secretary Of Hud
Purchase Details
Closed on
Jun 7, 2000
Sold by
Soriano Santiago
Bought by
Pineda Rafael
Home Financials for this Owner
Home Financials are based on the most recent Mortgage that was taken out on this home.
Original Mortgage
$255,000
Interest Rate
8.31%
Mortgage Type
Commercial
Purchase Details
Closed on
Aug 26, 1994
Sold by
Pioneer Bank & Trust Company
Bought by
Pineda Rafael and Soriano Santiago
Home Financials for this Owner
Home Financials are based on the most recent Mortgage that was taken out on this home.
Original Mortgage
$143,550
Interest Rate
8.65%
Mortgage Type
FHA
Purchase Details
Closed on
May 26, 1994
Sold by
Capitol Bank & Trust
Bought by
Pioneer Bank & Trust
Purchase Details
Closed on
Apr 14, 1994
Sold by
Bancboston Mtg Corp
Bought by
Capitol Bank & Trust
Purchase Details
Closed on
Nov 8, 1993
Sold by
Rot James and Arden Rot Marianne
Bought by
Lassiter Catherine M
Create a Home Valuation Report for This Property
The Home Valuation Report is an in-depth analysis detailing your home's value as well as a comparison with similar homes in the area
Home Values in the Area
Average Home Value in this Area
Purchase History
| Date | Buyer | Sale Price | Title Company |
|---|---|---|---|
| V O T Properties Llc | -- | Attorney | |
| Dormun Alphonso | -- | Attorney | |
| V O T Properties Llc | $26,000 | Greater Illinois Title | |
| Black Kendra | $32,000 | Stewart Title | |
| Groundfloor Properties Ga Llc | -- | Attorney | |
| Jones Asset Management Llc | $12,500 | First American Title | |
| Arbanas Worldwide Llc | -- | First American Title Ins Co | |
| Arbanas Michael B | $510,000 | Premier Title | |
| Campbell William | -- | Stewart Title Company | |
| Secretary Of Hud | -- | None Available | |
| Pineda Rafael | -- | -- | |
| Pineda Rafael | $145,000 | Attorneys Natl Title Network | |
| Pioneer Bank & Trust | -- | -- | |
| Capitol Bank & Trust | $15,000 | -- | |
| Lassiter Catherine M | $9,333 | -- |
Source: Public Records
Mortgage History
| Date | Status | Borrower | Loan Amount |
|---|---|---|---|
| Previous Owner | Arbanas Michael B | $408,000 | |
| Previous Owner | Pineda Rafael | $255,000 | |
| Previous Owner | Pineda Rafael | $143,550 |
Source: Public Records
Tax History
| Year | Tax Paid | Tax Assessment Tax Assessment Total Assessment is a certain percentage of the fair market value that is determined by local assessors to be the total taxable value of land and additions on the property. | Land | Improvement |
|---|---|---|---|---|
| 2025 | $8,051 | $11,000 | $2,664 | $8,336 |
| 2024 | $8,051 | $11,000 | $2,664 | $8,336 |
| 2023 | $4,685 | $11,000 | $2,664 | $8,336 |
| 2022 | $4,685 | $3,486 | $2,474 | $1,012 |
| 2021 | $4,597 | $3,484 | $2,473 | $1,011 |
| 2020 | $4,191 | $3,484 | $2,473 | $1,011 |
| 2019 | $5,919 | $5,438 | $2,283 | $3,155 |
| 2018 | $6,179 | $5,891 | $2,283 | $3,608 |
| 2017 | $6,141 | $5,891 | $2,283 | $3,608 |
| 2016 | $5,133 | $5,163 | $2,093 | $3,070 |
| 2015 | $5,016 | $5,163 | $2,093 | $3,070 |
| 2014 | $4,869 | $5,163 | $2,093 | $3,070 |
| 2013 | $5,714 | $6,763 | $2,093 | $4,670 |
Source: Public Records
Map
Nearby Homes
- 154 Sundance Rd
- 20001 Arquilla Cir
- 135 Treehouse Rd
- 153 Treehouse Rd
- 19611 Crawford Ave
- 4141 204th St
- 4500 203rd St
- 4114 195th St Unit 76A
- 19424 Cypress Dr Unit 1C
- 19435 Hickory Place Unit 29A
- 3507 Park Place
- 19361 Oak Ave Unit 19361
- 19409 Hickory Place Unit 32D
- 3427 Vollmer Rd Unit 205
- 3427 Vollmer Rd Unit 202
- 3427 Vollmer Rd Unit 209
- 19320 Oakwood Ave Unit 49
- 3415 Vollmer Rd Unit 308
- 3506 Ithaca Rd
- 620 Larkspur Ln
- 20001 Keystone Ave
- 20020 Keystone Ave Unit 1
- 19957 Keystone Ave
- 20031 Keystone Ave
- 19951 Keystone Ave
- 20030 Keystone Ave
- 19942 Keystone Ave
- 19980 Crawford Ave
- 4105 Sunset Rd
- 19950 Crawford Ave
- 19930 Crawford Ave
- 20050 Keystone Ave
- 19990 Crawford Ave
- 20000 Crawford Ave
- 4108 Orchard Ln
- 4102 Orchard Ln
- 20056 Keystone Ave
- 4113 Sunset Rd
- 4112 Sunset Rd
Your Personal Tour Guide
Ask me questions while you tour the home.