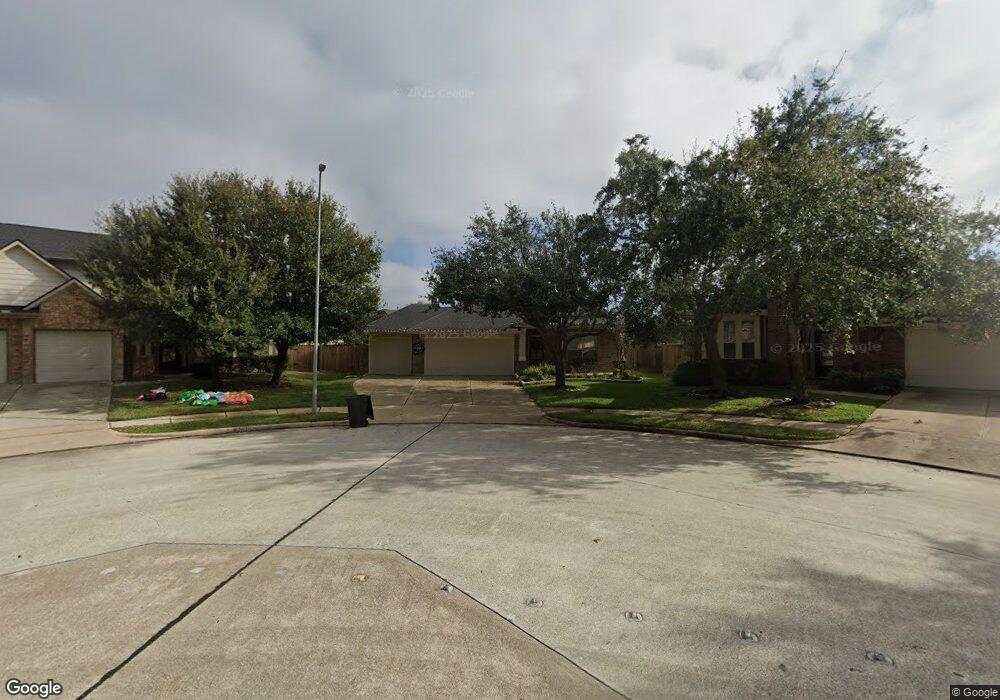
20002 Leithcrest Way Spring, TX 77379
Gleannloch Farms NeighborhoodEstimated Value: $340,000 - $352,000
3
Beds
2
Baths
2,130
Sq Ft
$162/Sq Ft
Est. Value
About This Home
This home is located at 20002 Leithcrest Way, Spring, TX 77379 and is currently estimated at $345,830, approximately $162 per square foot. 20002 Leithcrest Way is a home located in Harris County with nearby schools including Frank Elementary School, Doerre Intermediate School, and Klein Cain High School.
Ownership History
Date
Name
Owned For
Owner Type
Purchase Details
Closed on
Aug 18, 2014
Sold by
Cartus Financial Corporation
Bought by
Waldrop Lori C
Current Estimated Value
Home Financials for this Owner
Home Financials are based on the most recent Mortgage that was taken out on this home.
Original Mortgage
$199,500
Outstanding Balance
$151,515
Interest Rate
4.16%
Mortgage Type
New Conventional
Estimated Equity
$194,315
Purchase Details
Closed on
Apr 27, 2007
Sold by
Weekley Homes Lp
Bought by
Mcglashan Michael A and Mcglashan Tiffany C
Home Financials for this Owner
Home Financials are based on the most recent Mortgage that was taken out on this home.
Original Mortgage
$37,400
Interest Rate
6.13%
Mortgage Type
Stand Alone Second
Create a Home Valuation Report for This Property
The Home Valuation Report is an in-depth analysis detailing your home's value as well as a comparison with similar homes in the area
Home Values in the Area
Average Home Value in this Area
Purchase History
| Date | Buyer | Sale Price | Title Company |
|---|---|---|---|
| Waldrop Lori C | -- | -- | |
| Waldrop Lori C | -- | -- | |
| Cartus Financial Corporation | -- | -- | |
| Mcglashan Michael A | -- | Priority Title Co |
Source: Public Records
Mortgage History
| Date | Status | Borrower | Loan Amount |
|---|---|---|---|
| Open | Waldrop Lori C | $199,500 | |
| Closed | Waldrop Lori C | $199,500 | |
| Previous Owner | Mcglashan Michael A | $37,400 | |
| Previous Owner | Mcglashan Michael A | $149,600 |
Source: Public Records
Tax History
| Year | Tax Paid | Tax Assessment Tax Assessment Total Assessment is a certain percentage of the fair market value that is determined by local assessors to be the total taxable value of land and additions on the property. | Land | Improvement |
|---|---|---|---|---|
| 2025 | $6,674 | $335,915 | $66,284 | $269,631 |
| 2024 | $6,674 | $345,257 | $66,284 | $278,973 |
| 2023 | $6,674 | $375,674 | $66,284 | $309,390 |
| 2022 | $7,177 | $297,655 | $58,709 | $238,946 |
| 2021 | $6,978 | $255,455 | $39,392 | $216,063 |
| 2020 | $7,008 | $241,774 | $39,392 | $202,382 |
| 2019 | $6,794 | $225,825 | $39,392 | $186,433 |
| 2018 | $2,931 | $229,978 | $39,392 | $190,586 |
| 2017 | $6,975 | $229,978 | $39,392 | $190,586 |
| 2016 | $6,940 | $229,978 | $39,392 | $190,586 |
| 2015 | $5,436 | $208,012 | $39,392 | $168,620 |
| 2014 | $5,436 | $190,794 | $39,392 | $151,402 |
Source: Public Records
Map
Nearby Homes
- 9427 Thurber Ridge Dr
- 9535 Empress Crossing Dr
- 9526 Tartan Manor St
- 19814 Ringwald Ct
- 19830 Sternwood Manor Dr
- 9107 Huckinston Ct
- 19918 Letchfield Hollow Dr
- 9107 Fernwillow Dr
- 19907 Ogdenburg Falls Dr
- 20008 Champion Forest Dr Unit 1001
- 19902 Tidy Tips Ln
- 9935 Kirkstone Terrace Dr
- 20310 Dark Hollow Ln
- 20314 Dark Hollow Ln
- 10007 Elderberry Park Ln
- 9635 Old Timber Ln
- 9819 Friesian Estates Dr
- 10202 Berrybriar Ln
- 20019 Standing Cypress Dr
- 9622 Invergarry Way
- 9403 Thurber Ridge Dr
- 20006 Leithcrest Way
- 20015 Gunters Ridge Dr
- 20011 Gunters Ridge Dr
- 20019 Gunters Ridge Dr
- 20010 Leithcrest Way
- 20023 Gunters Ridge Dr
- 9411 Thurber Ridge Dr
- 20007 Gunters Ridge Dr
- 20014 Leithcrest Way
- 9406 Thurber Ridge Dr
- 9410 Thurber Ridge Dr
- 20027 Gunters Ridge Dr
- 9415 Thurber Ridge Dr
- 20118 Monarda Manor Ct
- 20003 Gunters Ridge Dr
- 20114 Monarda Manor Ct
- 20018 Leithcrest Way
- 20122 Monarda Manor Ct
- 20110 Monarda Manor Ct
Your Personal Tour Guide
Ask me questions while you tour the home.