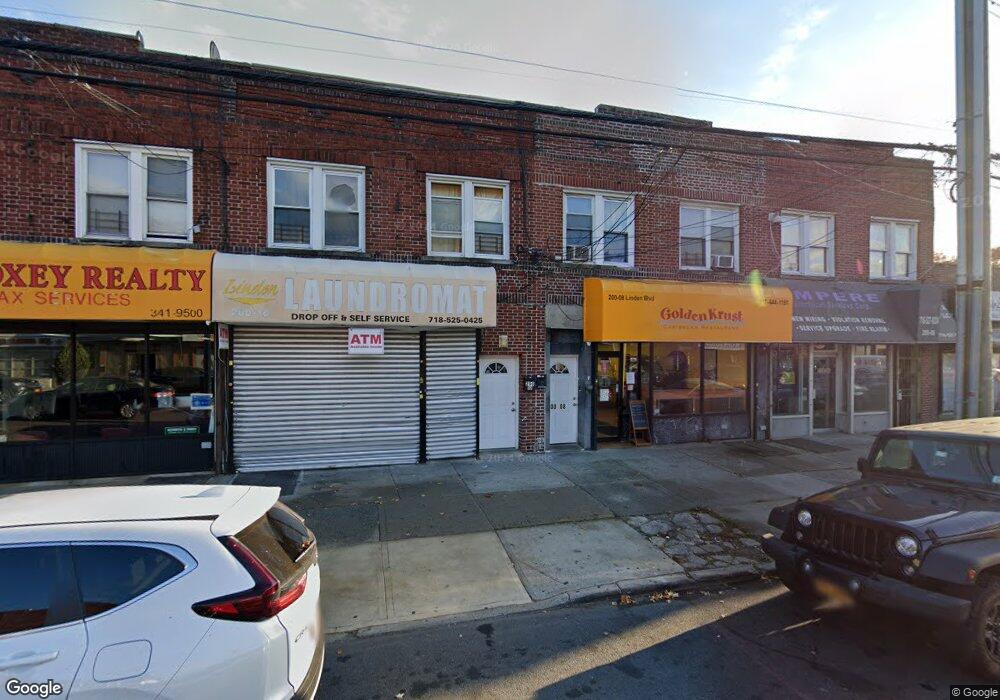
20008 Linden Blvd Jamaica, NY 11412
Saint Albans NeighborhoodEstimated Value: $681,932
--
Bed
--
Bath
2,800
Sq Ft
$244/Sq Ft
Est. Value
About This Home
This home is located at 20008 Linden Blvd, Jamaica, NY 11412 and is currently estimated at $681,932, approximately $243 per square foot. 20008 Linden Blvd is a home located in Queens County with nearby schools including P.S. 136 Roy Wilkins and I.S. 192 The Linden.
Ownership History
Date
Name
Owned For
Owner Type
Purchase Details
Closed on
Jul 16, 2004
Sold by
Bishop Carmini S and Moxey Fabia
Bought by
Morris Sandra
Current Estimated Value
Home Financials for this Owner
Home Financials are based on the most recent Mortgage that was taken out on this home.
Original Mortgage
$366,562
Interest Rate
6.33%
Mortgage Type
Commercial
Purchase Details
Closed on
May 30, 1998
Sold by
Sanker Bishop Carmini and Moxey Fabia
Bought by
Moxey Kenneth G and Sanker Bishop Carmini
Purchase Details
Closed on
Jan 29, 1998
Sold by
Lewis John
Bought by
Bishop Carmini Sanker and Moxey Fabia
Home Financials for this Owner
Home Financials are based on the most recent Mortgage that was taken out on this home.
Original Mortgage
$190,580
Interest Rate
6.92%
Mortgage Type
FHA
Create a Home Valuation Report for This Property
The Home Valuation Report is an in-depth analysis detailing your home's value as well as a comparison with similar homes in the area
Home Values in the Area
Average Home Value in this Area
Purchase History
| Date | Buyer | Sale Price | Title Company |
|---|---|---|---|
| Morris Sandra | $375,000 | -- | |
| Morris Sandra | $375,000 | -- | |
| Moxey Kenneth G | -- | -- | |
| Moxey Kenneth G | -- | -- | |
| Bishop Carmini Sanker | $125,000 | Fidelity National Title Ins | |
| Bishop Carmini Sanker | $125,000 | Fidelity National Title Ins |
Source: Public Records
Mortgage History
| Date | Status | Borrower | Loan Amount |
|---|---|---|---|
| Previous Owner | Morris Sandra | $366,562 | |
| Previous Owner | Bishop Carmini Sanker | $190,580 |
Source: Public Records
Tax History Compared to Growth
Tax History
| Year | Tax Paid | Tax Assessment Tax Assessment Total Assessment is a certain percentage of the fair market value that is determined by local assessors to be the total taxable value of land and additions on the property. | Land | Improvement |
|---|---|---|---|---|
| 2025 | $17,683 | $166,950 | $37,350 | $129,600 |
| 2024 | $17,683 | $166,950 | $37,350 | $129,600 |
| 2023 | $17,426 | $164,520 | $37,350 | $127,170 |
| 2022 | $17,094 | $182,700 | $37,350 | $145,350 |
| 2021 | $13,571 | $126,900 | $37,350 | $89,550 |
| 2020 | $13,722 | $171,000 | $37,350 | $133,650 |
| 2019 | $10,502 | $157,050 | $37,350 | $119,700 |
| 2018 | $7,606 | $72,342 | $21,708 | $50,634 |
| 2017 | $4,710 | $44,796 | $16,494 | $28,302 |
| 2016 | $3,862 | $44,796 | $16,494 | $28,302 |
| 2015 | $2,623 | $22,320 | $11,280 | $11,040 |
| 2014 | $2,623 | $22,260 | $11,250 | $11,010 |
Source: Public Records
Map
Nearby Homes
- 20017 Linden Blvd
- 19815 118th Ave
- 117-02 202nd St
- 118-27 201st St
- 118-22 201st
- 118-32 200th St
- 118 ave 202 St
- 117-31 202nd St
- 197-13 118th Ave
- 116-40 203rd St
- 197-20 118th Ave
- 200-19 119th Ave
- 115-47 199th St
- 19705 116th Ave
- 118-15 203rd St
- 196-10 116th Ave
- 115-69 203rd St
- 118-28 204th St
- 115-37 197th St
- 11608 196th St
- 20010 Linden Blvd
- 20006 Linden Blvd
- 200-10 Linden Blvd
- 200-16 Linden Blvd
- 20002 Linden Blvd
- 20014 Linden Blvd
- 11713 200th St
- 20016 Linden Blvd
- 20012 Linden Blvd
- 11715 200th St
- 117-15 200th St
- 200-18 Linden Blvd Unit 2R
- 200-18 Linden Blvd
- 20018 Linden Blvd
- 117-20 201st St
- 20020 Linden Blvd
- 11717 200th St
- 200-05 Linden Blvd Unit 1
- 200-05 Linden Blvd
- 200-03 Linden Blvd Unit 2