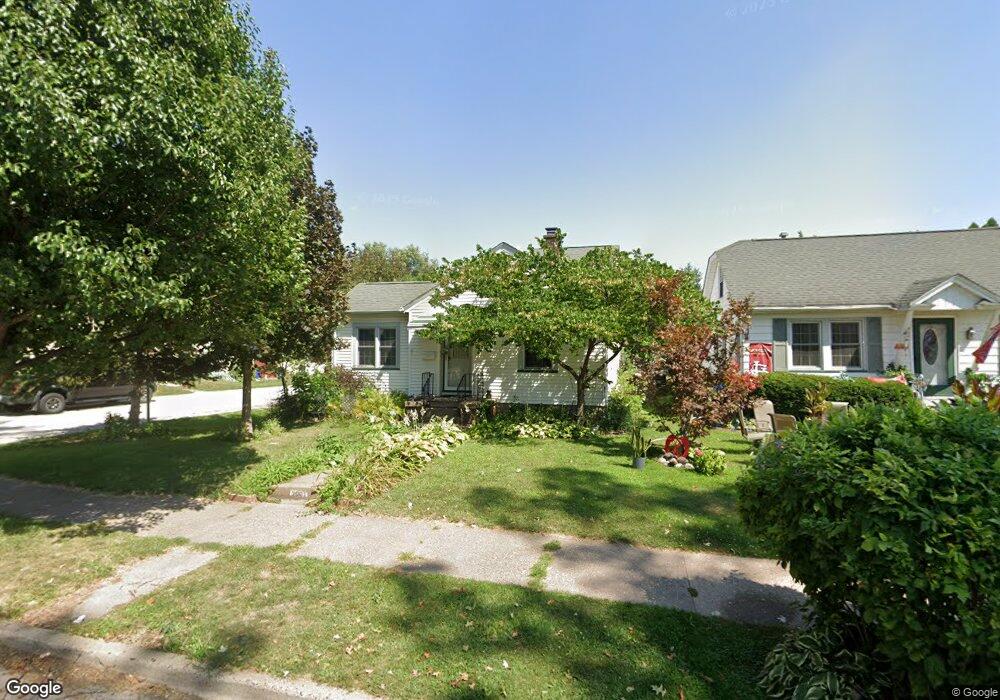
2001 46th St Rock Island, IL 61201
Karstens-City Line NeighborhoodEstimated Value: $108,072 - $125,000
--
Bed
--
Bath
1,038
Sq Ft
$116/Sq Ft
Est. Value
About This Home
This home is located at 2001 46th St, Rock Island, IL 61201 and is currently estimated at $120,268, approximately $115 per square foot. 2001 46th St is a home located in Rock Island County with nearby schools including Denkmann Elementary School, Washington Junior High School, and Rock Island High School.
Ownership History
Date
Name
Owned For
Owner Type
Purchase Details
Closed on
Jun 11, 2021
Sold by
Murphy Robert R
Bought by
Murphy Robert R and Murphy Lisa A
Current Estimated Value
Home Financials for this Owner
Home Financials are based on the most recent Mortgage that was taken out on this home.
Original Mortgage
$62,400
Outstanding Balance
$57,411
Interest Rate
4%
Mortgage Type
New Conventional
Estimated Equity
$62,857
Purchase Details
Closed on
Jul 1, 2006
Create a Home Valuation Report for This Property
The Home Valuation Report is an in-depth analysis detailing your home's value as well as a comparison with similar homes in the area
Home Values in the Area
Average Home Value in this Area
Purchase History
| Date | Buyer | Sale Price | Title Company |
|---|---|---|---|
| Murphy Robert R | -- | -- | |
| -- | $72,600 | -- |
Source: Public Records
Mortgage History
| Date | Status | Borrower | Loan Amount |
|---|---|---|---|
| Open | Murphy Robert R | $62,400 |
Source: Public Records
Tax History Compared to Growth
Tax History
| Year | Tax Paid | Tax Assessment Tax Assessment Total Assessment is a certain percentage of the fair market value that is determined by local assessors to be the total taxable value of land and additions on the property. | Land | Improvement |
|---|---|---|---|---|
| 2024 | $3,214 | $31,940 | $5,664 | $26,276 |
| 2023 | $3,214 | $29,222 | $5,182 | $24,040 |
| 2022 | $2,645 | $25,861 | $4,586 | $21,275 |
| 2021 | $2,592 | $24,559 | $4,355 | $20,204 |
| 2020 | $333 | $31,305 | $4,236 | $27,069 |
| 2019 | $2,450 | $30,995 | $4,194 | $26,801 |
| 2018 | $2,450 | $29,536 | $3,997 | $25,539 |
| 2017 | $2,376 | $28,553 | $3,863 | $24,690 |
| 2016 | $2,297 | $28,553 | $3,863 | $24,690 |
| 2015 | $2,288 | $28,553 | $3,863 | $24,690 |
| 2014 | $484 | $28,205 | $3,816 | $24,389 |
| 2013 | $484 | $28,205 | $3,816 | $24,389 |
Source: Public Records
Map
Nearby Homes