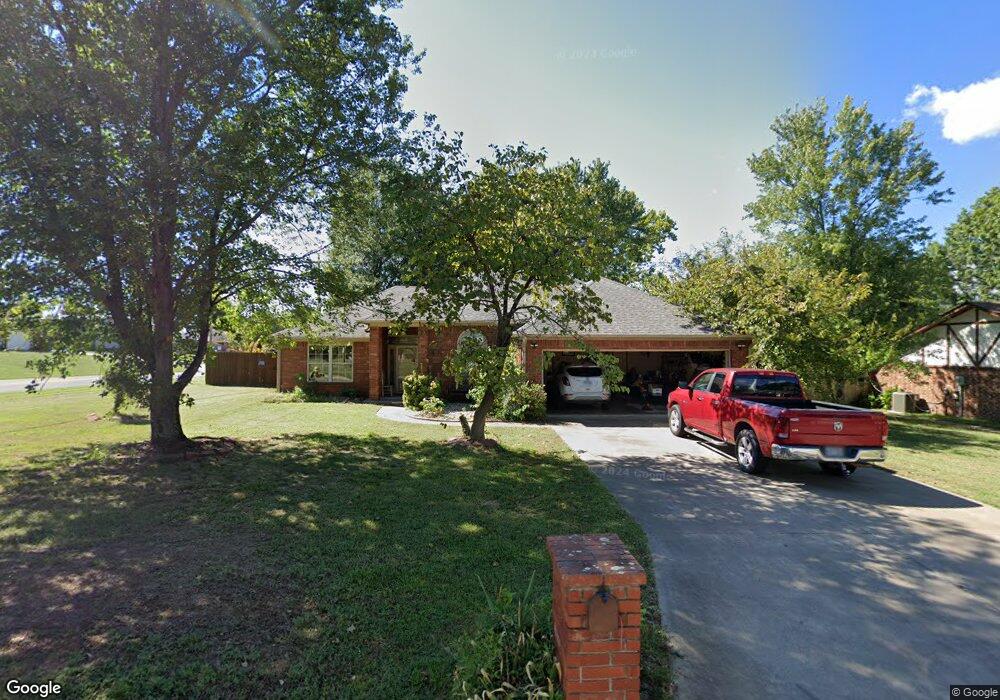
2001 Falls Branch Ln van Buren, AR 72956
Estimated Value: $221,000 - $256,000
--
Bed
3
Baths
1,677
Sq Ft
$141/Sq Ft
Est. Value
About This Home
This home is located at 2001 Falls Branch Ln, van Buren, AR 72956 and is currently estimated at $236,096, approximately $140 per square foot. 2001 Falls Branch Ln is a home located in Crawford County with nearby schools including Rena Elementary School, Northridge Middle School, and Van Buren High School.
Ownership History
Date
Name
Owned For
Owner Type
Purchase Details
Closed on
Jun 6, 2016
Sold by
Young Melanie Gay and Young James Ward
Bought by
Ramey Jim L and Ramey Amy J
Current Estimated Value
Home Financials for this Owner
Home Financials are based on the most recent Mortgage that was taken out on this home.
Original Mortgage
$127,546
Outstanding Balance
$100,158
Interest Rate
3.25%
Mortgage Type
FHA
Estimated Equity
$135,938
Purchase Details
Closed on
Feb 29, 2016
Sold by
Young Melanie Gay and Wilson Carl Newton
Bought by
Young Melanie Gay and Wilson Carl Newton
Purchase Details
Closed on
Jan 8, 2014
Sold by
Dibble James F and Dibble Gerlinde H
Bought by
Wilson Ncoma
Purchase Details
Closed on
Jan 2, 2014
Sold by
Wilson Neoma
Bought by
Wilson Carl N and Ezell Jennifer L
Purchase Details
Closed on
Sep 8, 1994
Bought by
Stamps-Dibble
Purchase Details
Closed on
Dec 1, 1983
Bought by
Edwards-Stamps
Create a Home Valuation Report for This Property
The Home Valuation Report is an in-depth analysis detailing your home's value as well as a comparison with similar homes in the area
Home Values in the Area
Average Home Value in this Area
Purchase History
| Date | Buyer | Sale Price | Title Company |
|---|---|---|---|
| Ramey Jim L | $129,900 | None Available | |
| Young Melanie Gay | -- | None Available | |
| Wilson Ncoma | $125,000 | None Available | |
| Wilson Carl N | -- | None Available | |
| Stamps-Dibble | $14,000 | -- | |
| Edwards-Stamps | $11,000 | -- |
Source: Public Records
Mortgage History
| Date | Status | Borrower | Loan Amount |
|---|---|---|---|
| Open | Ramey Jim L | $127,546 |
Source: Public Records
Tax History Compared to Growth
Tax History
| Year | Tax Paid | Tax Assessment Tax Assessment Total Assessment is a certain percentage of the fair market value that is determined by local assessors to be the total taxable value of land and additions on the property. | Land | Improvement |
|---|---|---|---|---|
| 2025 | $865 | $38,700 | $3,000 | $35,700 |
| 2024 | $902 | $38,700 | $3,000 | $35,700 |
| 2023 | $913 | $38,700 | $3,000 | $35,700 |
| 2022 | $899 | $24,550 | $2,000 | $22,550 |
| 2021 | $899 | $24,550 | $2,000 | $22,550 |
| 2020 | $899 | $24,550 | $2,000 | $22,550 |
| 2019 | $895 | $24,550 | $2,000 | $22,550 |
| 2018 | $863 | $24,550 | $2,000 | $22,550 |
| 2017 | $805 | $22,250 | $2,000 | $20,250 |
| 2016 | $592 | $22,250 | $2,000 | $20,250 |
| 2015 | $538 | $22,250 | $2,000 | $20,250 |
| 2014 | $538 | $22,250 | $2,000 | $20,250 |
Source: Public Records
Map
Nearby Homes
- 2005 Broken Hill Dr
- 2016 Broken Hill Dr
- 1714 River Ridge Rd
- TBD Rena Rd
- 2205 Quartz Cir
- 2203 Marble Cir
- 1610 Amble On Ln
- 2600 Pearl Blvd
- 843 Richmond Rd
- 1401 Azure Hills Dr
- 504 Fir Dr
- 1410 Valley Forge St
- 615 Azure Hills Dr
- 319 Copsey Dr
- 712 Jenny Wren St
- 305 Boulder Dr
- 310 Copsey Dr
- 1504 N Hills Blvd
- TBD Jenny Wren St
- 716 Lisa Ln W
- 2003 Falls Branch Ln
- 1110 Rena Rd
- 2005 Falls Branch Ln
- 1107 Rena Rd
- 1102 Rena Rd
- 1109 Rena Rd
- 2002 Falls Branch Ln
- 1111 Rena Rd
- 1101 Rena Rd
- 2004 Falls Branch Ln
- 2007 Falls Branch Ln
- 1015 Rena Rd
- 1113 Rena Rd
- 2006 Falls Branch Ln
- 2001 Foster Branch Ln
- 1118 Rena Rd
- 2003 Foster Branch Ln
- 2009 Falls Branch Ln
- 1013 Rena Rd
- 2005 Foster Branch Ln