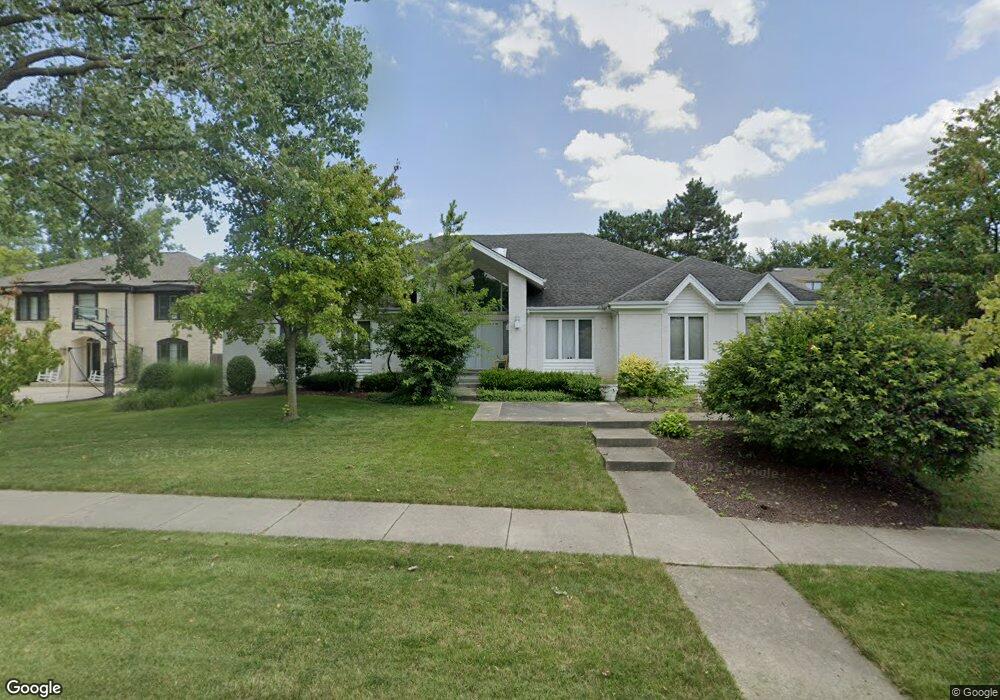
2001 Franklin Dr Glenview, IL 60026
Estimated Value: $957,000 - $1,111,000
5
Beds
4
Baths
3,388
Sq Ft
$296/Sq Ft
Est. Value
About This Home
This home is located at 2001 Franklin Dr, Glenview, IL 60026 and is currently estimated at $1,002,569, approximately $295 per square foot. 2001 Franklin Dr is a home located in Cook County with nearby schools including Henry Winkelman Elementary School, Field Middle School, and Glenbrook South High School.
Ownership History
Date
Name
Owned For
Owner Type
Purchase Details
Closed on
Jun 18, 2010
Sold by
Kang Dee
Bought by
Moy Chin Michael and Moy Chin Sybil
Current Estimated Value
Home Financials for this Owner
Home Financials are based on the most recent Mortgage that was taken out on this home.
Original Mortgage
$417,000
Outstanding Balance
$275,154
Interest Rate
4.97%
Mortgage Type
New Conventional
Estimated Equity
$727,415
Purchase Details
Closed on
Dec 27, 2001
Sold by
Nam Sangkook and Nam Sue S
Bought by
Kang Dee
Home Financials for this Owner
Home Financials are based on the most recent Mortgage that was taken out on this home.
Original Mortgage
$516,000
Interest Rate
7%
Mortgage Type
Unknown
Purchase Details
Closed on
Jun 27, 1997
Sold by
Stevens Julie A
Bought by
Nam Sangkook and Nam Sue S
Home Financials for this Owner
Home Financials are based on the most recent Mortgage that was taken out on this home.
Original Mortgage
$350,000
Interest Rate
7.94%
Purchase Details
Closed on
Sep 28, 1995
Sold by
Lemick Michael R
Bought by
Stevens Julie A and Lemick Julie A
Create a Home Valuation Report for This Property
The Home Valuation Report is an in-depth analysis detailing your home's value as well as a comparison with similar homes in the area
Home Values in the Area
Average Home Value in this Area
Purchase History
| Date | Buyer | Sale Price | Title Company |
|---|---|---|---|
| Moy Chin Michael | $572,000 | None Available | |
| Kang Dee | $645,000 | Chicago Title Insurance Co | |
| Nam Sangkook | $525,000 | -- | |
| Stevens Julie A | -- | -- |
Source: Public Records
Mortgage History
| Date | Status | Borrower | Loan Amount |
|---|---|---|---|
| Open | Moy Chin Michael | $417,000 | |
| Previous Owner | Kang Dee | $516,000 | |
| Previous Owner | Nam Sangkook | $350,000 |
Source: Public Records
Tax History
| Year | Tax Paid | Tax Assessment Tax Assessment Total Assessment is a certain percentage of the fair market value that is determined by local assessors to be the total taxable value of land and additions on the property. | Land | Improvement |
|---|---|---|---|---|
| 2025 | $14,826 | $94,000 | $12,442 | $81,558 |
| 2024 | $14,826 | $71,718 | $14,515 | $57,203 |
| 2023 | $14,718 | $71,718 | $14,515 | $57,203 |
| 2022 | $14,718 | $71,718 | $14,515 | $57,203 |
| 2021 | $9,421 | $41,031 | $12,441 | $28,590 |
| 2020 | $9,036 | $41,031 | $12,441 | $28,590 |
| 2019 | $8,666 | $44,599 | $12,441 | $32,158 |
| 2018 | $11,858 | $54,818 | $10,886 | $43,932 |
| 2017 | $12,339 | $58,420 | $10,886 | $47,534 |
| 2016 | $14,141 | $68,838 | $10,886 | $57,952 |
| 2015 | $11,871 | $53,025 | $8,812 | $44,213 |
| 2014 | $11,556 | $53,025 | $8,812 | $44,213 |
| 2013 | $11,299 | $53,025 | $8,812 | $44,213 |
Source: Public Records
Map
Nearby Homes
- 3246 Landwehr Rd Unit 3
- 4408 Hammersmith Ln
- 3190 Landwehr Rd
- 2308 Indian Ridge Dr
- 4142 Hampton Ct
- 3404 Salem Walk
- 3428 Salem Walk
- 3606 Salem Walk
- 3456 Salem Walk
- 1594 Portage Run
- 3250 Sanders Rd Unit 10C
- 3266 Sanders Rd Unit 6F
- 3800 Kiess Dr
- 2501 Indian Ridge Dr
- 3856 S Parkway Dr Unit 3B
- 4715 W Lake Ave
- 3240 Brookdale Ln
- 2803 Wildflower Ct
- 3806 Michael Ln
- 1223 Milwaukee Ave
- 1921 Franklin Dr
- 2005 Franklin Dr
- 2009 Franklin Dr
- 2000 Franklin Dr
- 1919 Franklin Dr
- 2004 Franklin Dr Unit 1
- 1917 Franklin Dr
- 1915 Franklin Dr
- 2008 Franklin Dr
- 1920 Franklin Dr
- 2015 Franklin Dr
- 3360 Overland Pass
- 2012 Franklin Dr
- 4312 Hammersmith Ln
- 4312 Hammersmith Ln
- 4313 Hammersmith Ln
- 1916 Franklin Dr
- 2021 Franklin Dr
- 2021 Franklin Dr
- 2016 Franklin Dr
Your Personal Tour Guide
Ask me questions while you tour the home.