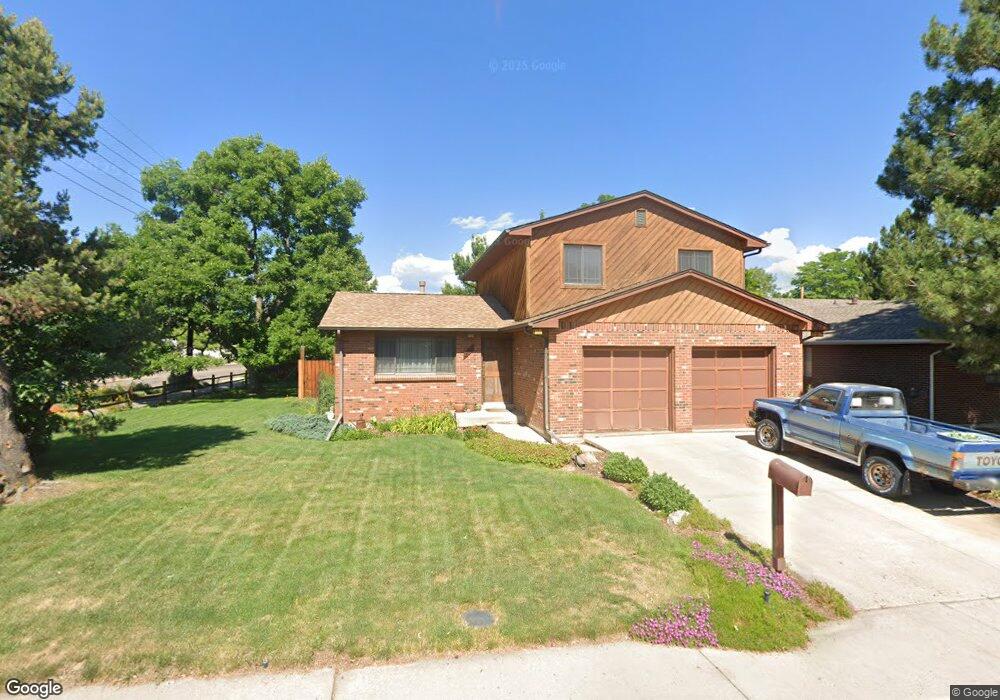
2001 Lewis St Lakewood, CO 80215
Applewood Valley NeighborhoodEstimated Value: $585,000 - $769,000
3
Beds
3
Baths
1,483
Sq Ft
$439/Sq Ft
Est. Value
About This Home
This home is located at 2001 Lewis St, Lakewood, CO 80215 and is currently estimated at $650,605, approximately $438 per square foot. 2001 Lewis St is a home located in Jefferson County with nearby schools including Lovelia P. Flournoy Elementary School, Stober Elementary School, and Everitt Middle School.
Ownership History
Date
Name
Owned For
Owner Type
Purchase Details
Closed on
Feb 18, 2003
Sold by
Foster Tonya S and Mahannah Lisa A
Bought by
Phillips David A
Current Estimated Value
Home Financials for this Owner
Home Financials are based on the most recent Mortgage that was taken out on this home.
Original Mortgage
$204,750
Interest Rate
3.75%
Purchase Details
Closed on
May 15, 2000
Sold by
Hutchens Jeffrey J
Bought by
Foster Tonya S and Mahannah Lisa A
Home Financials for this Owner
Home Financials are based on the most recent Mortgage that was taken out on this home.
Original Mortgage
$188,700
Interest Rate
8.18%
Mortgage Type
FHA
Purchase Details
Closed on
May 15, 1998
Sold by
Molloy Desmond J and Molloy Sharon A
Bought by
Hutchens Jeffrey J
Home Financials for this Owner
Home Financials are based on the most recent Mortgage that was taken out on this home.
Original Mortgage
$166,250
Interest Rate
7.11%
Mortgage Type
VA
Create a Home Valuation Report for This Property
The Home Valuation Report is an in-depth analysis detailing your home's value as well as a comparison with similar homes in the area
Home Values in the Area
Average Home Value in this Area
Purchase History
| Date | Buyer | Sale Price | Title Company |
|---|---|---|---|
| Phillips David A | $227,500 | -- | |
| Foster Tonya S | $190,000 | -- | |
| Hutchens Jeffrey J | $163,000 | North American Title |
Source: Public Records
Mortgage History
| Date | Status | Borrower | Loan Amount |
|---|---|---|---|
| Previous Owner | Phillips David A | $204,750 | |
| Previous Owner | Foster Tonya S | $188,700 | |
| Previous Owner | Hutchens Jeffrey J | $166,250 |
Source: Public Records
Tax History Compared to Growth
Tax History
| Year | Tax Paid | Tax Assessment Tax Assessment Total Assessment is a certain percentage of the fair market value that is determined by local assessors to be the total taxable value of land and additions on the property. | Land | Improvement |
|---|---|---|---|---|
| 2024 | $3,362 | $35,067 | $15,260 | $19,807 |
| 2023 | $3,362 | $35,067 | $15,260 | $19,807 |
| 2022 | $3,032 | $30,760 | $15,789 | $14,971 |
| 2021 | $3,057 | $31,645 | $16,243 | $15,402 |
| 2020 | $2,807 | $29,060 | $14,446 | $14,614 |
| 2019 | $2,771 | $29,060 | $14,446 | $14,614 |
| 2018 | $2,889 | $29,521 | $11,250 | $18,271 |
| 2017 | $2,599 | $29,521 | $11,250 | $18,271 |
| 2016 | $2,219 | $23,713 | $6,384 | $17,329 |
| 2015 | $1,890 | $23,713 | $6,384 | $17,329 |
| 2014 | $1,890 | $18,404 | $5,445 | $12,959 |
Source: Public Records
Map
Nearby Homes
- 2005 Nelson St
- 10560 W 23rd Place
- 2450 Miller St
- 2490 Lewis St
- 2451 Kipling St Unit 214
- 2451 Kipling St Unit 201
- 11133 W 17th Ave Unit 105
- 2555 Lewis Ct
- 1670 Kipling St
- 10185 W 25th Ave Unit 29
- 2060 Hoyt St
- 2055 Quail Dr
- 11217 W 18th Ave Unit A
- 30 Hillside Dr
- 2580 Hoyt St
- 1390 Lewis St
- 1350 Lewis St
- 1723 N Robb St Unit 56
- 2615 Oak Dr Unit 40
- 10445 W 13th Place