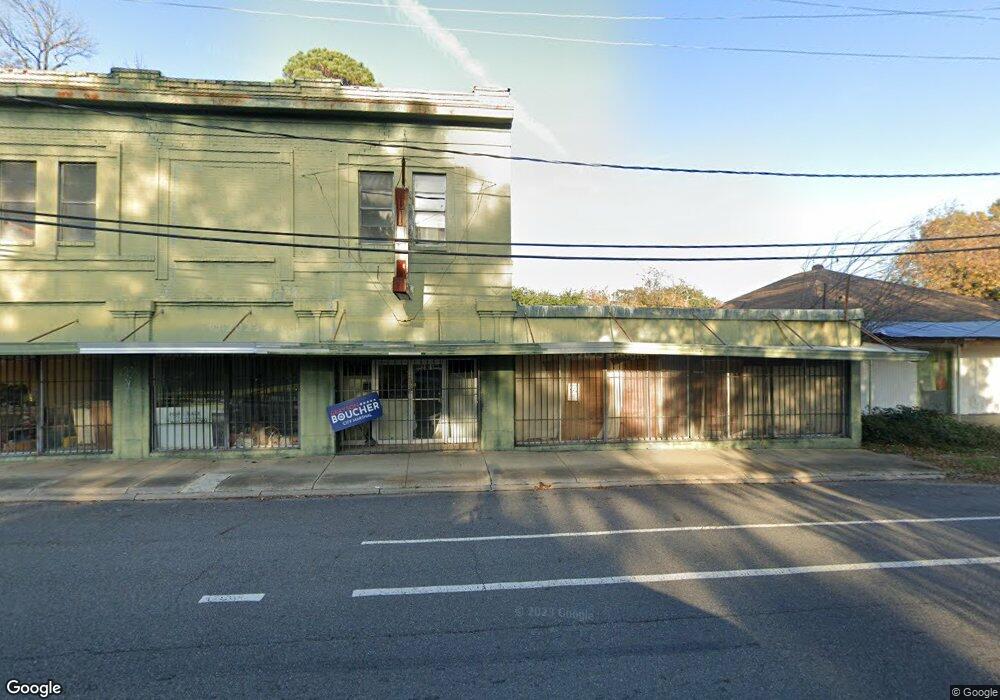
2001 Marshall St Shreveport, LA 71101
Highland/Stoner Hill NeighborhoodEstimated Value: $68,788 - $109,000
4
Beds
3
Baths
1,788
Sq Ft
$47/Sq Ft
Est. Value
About This Home
This home is located at 2001 Marshall St, Shreveport, LA 71101 and is currently estimated at $83,197, approximately $46 per square foot. 2001 Marshall St is a home located in Caddo Parish with nearby schools including South Highlands Elementary, Judson Fundamental Elementary School, and Fairfield Magnet School.
Ownership History
Date
Name
Owned For
Owner Type
Purchase Details
Closed on
Jun 20, 2014
Sold by
Abdul Rahman Tahira
Bought by
Parish Of Caddo
Current Estimated Value
Purchase Details
Closed on
Jun 13, 2014
Sold by
Abdul Rahman Tahira
Bought by
Heartland Investors Mbo Harris
Purchase Details
Closed on
Feb 21, 2014
Sold by
Abdul Rahman Tahira
Bought by
Hutson Robert Marshall
Purchase Details
Closed on
Apr 14, 2010
Sold by
Messina Messina Donna Cecilia Donna Cecilia and Messina Barnard Donna Cecilia
Bought by
Abdul Rahman Tahira
Create a Home Valuation Report for This Property
The Home Valuation Report is an in-depth analysis detailing your home's value as well as a comparison with similar homes in the area
Home Values in the Area
Average Home Value in this Area
Purchase History
| Date | Buyer | Sale Price | Title Company |
|---|---|---|---|
| Parish Of Caddo | $708 | None Available | |
| Heartland Investors Mbo Harris | $330 | None Available | |
| Hutson Robert Marshall | $7,500 | None Available | |
| Abdul Rahman Tahira | $7,500 | None Available |
Source: Public Records
Tax History Compared to Growth
Tax History
| Year | Tax Paid | Tax Assessment Tax Assessment Total Assessment is a certain percentage of the fair market value that is determined by local assessors to be the total taxable value of land and additions on the property. | Land | Improvement |
|---|---|---|---|---|
| 2024 | $481 | $3,087 | $348 | $2,739 |
| 2023 | $492 | $3,087 | $348 | $2,739 |
| 2022 | $476 | $2,985 | $348 | $2,637 |
| 2021 | $469 | $2,985 | $348 | $2,637 |
| 2020 | $469 | $2,985 | $348 | $2,637 |
| 2019 | $483 | $2,985 | $348 | $2,637 |
| 2018 | $384 | $2,985 | $348 | $2,637 |
| 2017 | $490 | $2,985 | $348 | $2,637 |
| 2015 | $487 | $3,756 | $348 | $3,408 |
| 2014 | $469 | $3,590 | $350 | $3,240 |
| 2013 | -- | $3,590 | $350 | $3,240 |
Source: Public Records
Map
Nearby Homes
- 296 Wall St
- 235 Vine St
- 449 Egan St Unit 4
- 555 Wall St
- 532 Egan St
- 0 Creswell Ave
- 1414 Highland Ave Unit 15
- 1414 Highland Ave
- 1105 Foster St
- 1528 Magnolia Ave
- 241 Herndon St
- 233 Herndon St
- 229 Herndon St
- 147 Jordan St
- 666 Buckelew St
- 400 Wyandotte St
- 159 Lister St
- 412 Wyandotte St
- 621 Wyandotte St
- 618 Wyandotte St