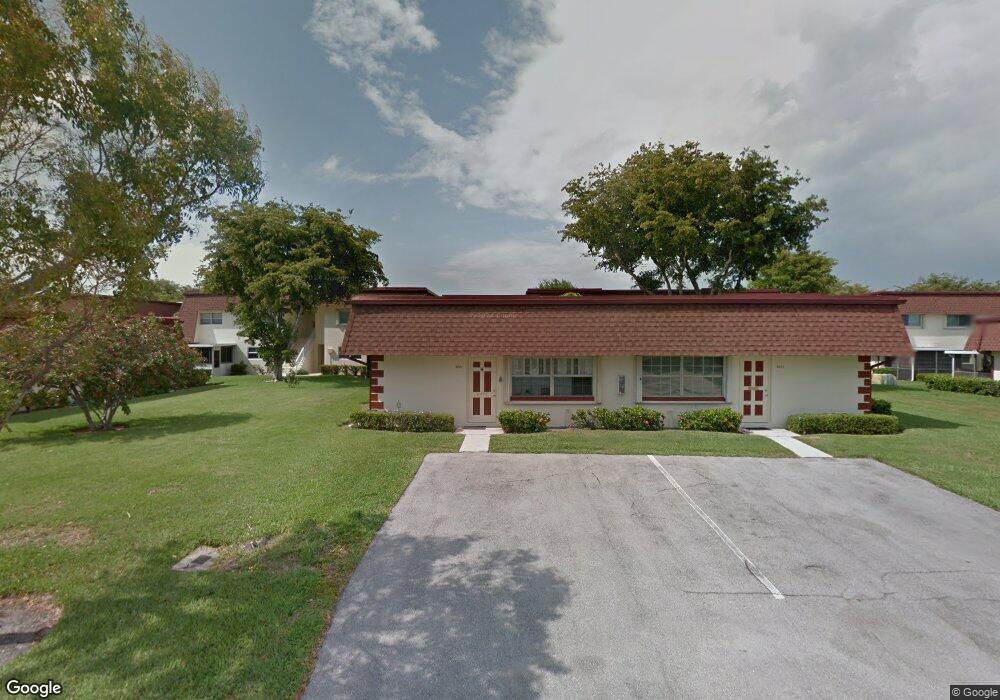
2001 NE 32nd St Unit 16 Lighthouse Point, FL 33064
Estimated Value: $278,000 - $325,000
3
Beds
2
Baths
950
Sq Ft
$312/Sq Ft
Est. Value
About This Home
This home is located at 2001 NE 32nd St Unit 16, Lighthouse Point, FL 33064 and is currently estimated at $296,213, approximately $311 per square foot. 2001 NE 32nd St Unit 16 is a home located in Broward County with nearby schools including Norcrest Elementary School, Deerfield Beach Middle School, and Deerfield Beach High School.
Ownership History
Date
Name
Owned For
Owner Type
Purchase Details
Closed on
Jan 15, 2025
Sold by
Moss Peter A and Moss Theresa A
Bought by
Rhein Kathleen
Current Estimated Value
Purchase Details
Closed on
Sep 12, 2023
Sold by
Moss Peter A and Moss Theresa A
Bought by
Moss Peter A and Moss Peter A
Purchase Details
Closed on
Dec 7, 2017
Sold by
Ross Robert E and The Elizabeth G Ross Revocable
Bought by
Moss Peter A and Moss Theresa M
Home Financials for this Owner
Home Financials are based on the most recent Mortgage that was taken out on this home.
Original Mortgage
$93,750
Interest Rate
3.94%
Mortgage Type
New Conventional
Purchase Details
Closed on
Mar 16, 2006
Sold by
Garretson Ross Elizabeth
Bought by
Ross Elizabeth G and Elizabeth G Ross Revocable Tru
Purchase Details
Closed on
Jun 1, 1991
Create a Home Valuation Report for This Property
The Home Valuation Report is an in-depth analysis detailing your home's value as well as a comparison with similar homes in the area
Home Values in the Area
Average Home Value in this Area
Purchase History
| Date | Buyer | Sale Price | Title Company |
|---|---|---|---|
| Rhein Kathleen | $328,000 | Fishermans Title | |
| Rhein Kathleen | $328,000 | Fishermans Title | |
| Moss Peter A | -- | None Listed On Document | |
| Moss Peter A | $145,000 | Attorney | |
| Ross Elizabeth G | -- | None Available | |
| -- | $7,857 | -- |
Source: Public Records
Mortgage History
| Date | Status | Borrower | Loan Amount |
|---|---|---|---|
| Previous Owner | Moss Peter A | $93,750 |
Source: Public Records
Tax History Compared to Growth
Tax History
| Year | Tax Paid | Tax Assessment Tax Assessment Total Assessment is a certain percentage of the fair market value that is determined by local assessors to be the total taxable value of land and additions on the property. | Land | Improvement |
|---|---|---|---|---|
| 2025 | $4,327 | $170,630 | -- | -- |
| 2024 | $4,189 | $170,630 | -- | -- |
| 2023 | $4,189 | $141,020 | $0 | $0 |
| 2022 | $3,319 | $128,200 | $0 | $0 |
| 2021 | $2,869 | $116,550 | $0 | $0 |
| 2020 | $2,555 | $105,960 | $10,600 | $95,360 |
| 2019 | $2,506 | $103,480 | $10,350 | $93,130 |
| 2018 | $2,594 | $113,260 | $11,330 | $101,930 |
| 2017 | $1,069 | $71,050 | $0 | $0 |
| 2016 | $1,048 | $69,590 | $0 | $0 |
| 2015 | $721 | $69,110 | $0 | $0 |
| 2014 | $729 | $68,570 | $0 | $0 |
| 2013 | -- | $85,830 | $8,580 | $77,250 |
Source: Public Records
Map
Nearby Homes
- 2015 NE 32nd Ct Unit 25
- 2011 NE 32nd Ct Unit 26
- 2000 NE 33rd St Unit 5
- 1960 NE 32nd St
- 1991 NE 34th St
- 3401 NE 21st Ave
- 1961 NE 31st St
- 2200 NE 33rd St
- 2120 NE 34th Ct
- 1960 NE 31st St
- 1990 NE 35th St
- 2111 NE 35th St
- 1950 NE 30th St
- 2200 NE 36th St Unit 3
- 2130 NE 36th St Unit 63
- 2202 NE 36th St Unit 15
- 2160 NE 36th St Unit 40
- 2162 NE 36th St Unit 46
- 3112 NE 17th Ave
- 2300 NE 34th Ct
- 2025 NE 32nd St Unit 11
- 2021 NE 32nd St Unit 12
- 1991 NE 32nd St
- 1996 NE 32nd Ct Unit 43
- 2011 NE 32nd Ct Unit 24
- 1995 NE 32nd St Unit 17
- 1981 NE 32nd Ct Unit 48
- 2016 NE 32nd Ct Unit 27
- 1975 NE 32nd Ct Unit 61
- 1990 NE 32nd Ct Unit 44
- 2016 NE 32nd Ct Unit 29
- 2015 NE 32nd Ct Unit 23
- 3225 NE 21st Ave Unit 7
- 1971 NE 32nd Ct Unit 62
- 1990 NE 32nd Ct Unit 46
- 2006 NE 32nd Ct Unit 35
- 3217 NE 21st Ave Unit 9
- 2005 NE 32nd St Unit 15
- 3221 NE 21st Ave Unit 8
- 1970 NE 32nd Ct Unit 57