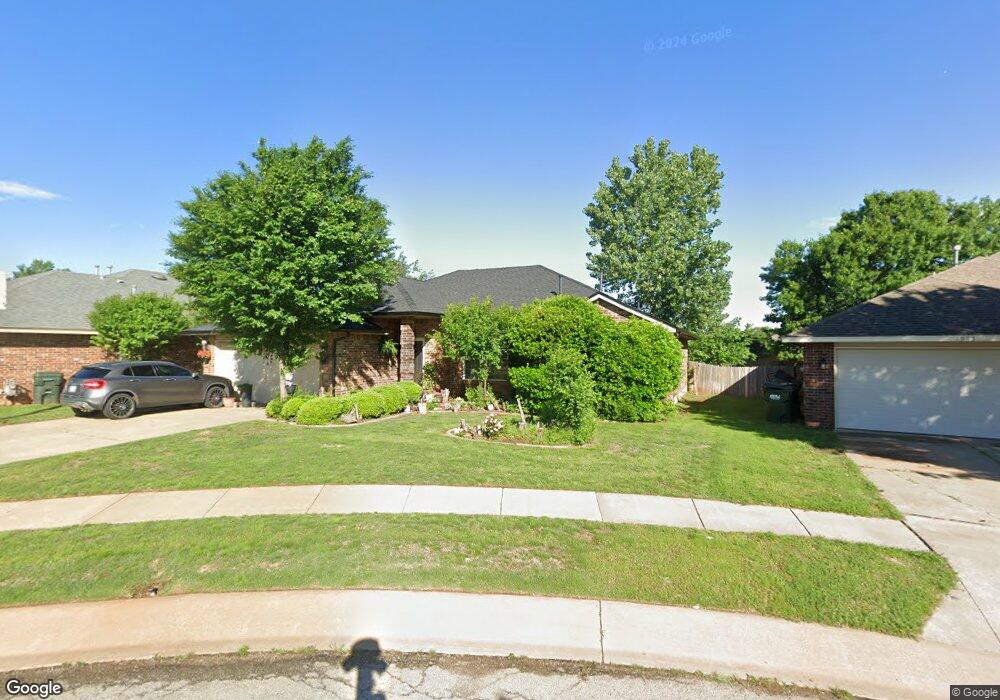
2001 Pleasant Ridge Ct Edmond, OK 73012
Deer Creek NeighborhoodEstimated Value: $231,000 - $251,000
3
Beds
2
Baths
1,551
Sq Ft
$157/Sq Ft
Est. Value
About This Home
This home is located at 2001 Pleasant Ridge Ct, Edmond, OK 73012 and is currently estimated at $244,235, approximately $157 per square foot. 2001 Pleasant Ridge Ct is a home located in Oklahoma County with nearby schools including Prairie Vale Elementary School, Deer Creek Middle School, and Deer Creek Intermediate School.
Ownership History
Date
Name
Owned For
Owner Type
Purchase Details
Closed on
Jun 18, 2013
Sold by
Lowe Janet V
Bought by
Janbay Nasser
Current Estimated Value
Home Financials for this Owner
Home Financials are based on the most recent Mortgage that was taken out on this home.
Original Mortgage
$119,000
Outstanding Balance
$84,838
Interest Rate
3.54%
Mortgage Type
New Conventional
Estimated Equity
$159,397
Purchase Details
Closed on
Jun 18, 2007
Sold by
Miller Nichole L and Miller Roland
Bought by
Lowe Janet V
Home Financials for this Owner
Home Financials are based on the most recent Mortgage that was taken out on this home.
Original Mortgage
$70,000
Interest Rate
6.19%
Mortgage Type
Purchase Money Mortgage
Purchase Details
Closed on
May 28, 2004
Sold by
Colony Homes Inc
Bought by
Miller Nichole L
Create a Home Valuation Report for This Property
The Home Valuation Report is an in-depth analysis detailing your home's value as well as a comparison with similar homes in the area
Home Values in the Area
Average Home Value in this Area
Purchase History
| Date | Buyer | Sale Price | Title Company |
|---|---|---|---|
| Janbay Nasser | $150,000 | Trustmark Title | |
| Lowe Janet V | $145,000 | First American Title & Tr Co | |
| Miller Nichole L | $133,000 | First American Title & Tr Co |
Source: Public Records
Mortgage History
| Date | Status | Borrower | Loan Amount |
|---|---|---|---|
| Open | Janbay Nasser | $119,000 | |
| Previous Owner | Lowe Janet V | $70,000 |
Source: Public Records
Tax History Compared to Growth
Tax History
| Year | Tax Paid | Tax Assessment Tax Assessment Total Assessment is a certain percentage of the fair market value that is determined by local assessors to be the total taxable value of land and additions on the property. | Land | Improvement |
|---|---|---|---|---|
| 2024 | $2,678 | $22,662 | $2,780 | $19,882 |
| 2023 | $2,678 | $21,583 | $2,774 | $18,809 |
| 2022 | $2,360 | $20,555 | $3,107 | $17,448 |
| 2021 | $2,210 | $19,577 | $3,240 | $16,337 |
| 2020 | $2,322 | $18,645 | $3,259 | $15,386 |
| 2019 | $130 | $17,844 | $3,253 | $14,591 |
| 2018 | $124 | $16,995 | $0 | $0 |
| 2017 | $125 | $17,159 | $3,259 | $13,900 |
| 2016 | $2,141 | $17,049 | $2,602 | $14,447 |
| 2015 | $1,905 | $16,516 | $2,602 | $13,914 |
| 2014 | $1,864 | $15,986 | $2,602 | $13,384 |
Source: Public Records
Map
Nearby Homes
- 21998 Homesteaders Rd
- 1814 Olde School Rd
- 1701 Birchfield Rd
- 1833 Lariat Trail
- 21755 Long Trail
- 2021 Raineys Blvd
- 1798 Long Trail
- 1988 Tall Grass Cir
- 22576 Pine Bluff Way
- 22301 Pine Bluff Way
- 2300 NW 220th Terrace
- 4317 Ritter Rd
- 3316 Holland Cir
- 3324 Holland Cir
- 21900 N Douglas Ave
- 3324 Courtney Creek Dr
- 21222 Robin Ridge Ln
- 3232 Courtney Creek Dr
- 2220 NW 227th St
- 2270 NW 227th St
- 2015 Pleasant Ridge Ct
- 1993 Pleasant Ridge Ct
- 2002 Mill Hollow Rd
- 1996 Mill Hollow Rd
- 2014 Mill Hollow Rd
- 1975 Pleasant Ridge Ct
- 1986 Mill Hollow Rd
- 2014 Pleasant Ridge Ct
- 1974 Pleasant Ridge Ct
- 1976 Mill Hollow Rd
- 2002 Pleasant Ridge Ct
- 21907 Pleasant Ridge Rd
- 21911 Pleasant Ridge Rd
- 21903 Pleasant Ridge Rd
- 1986 Pleasant Ridge Ct
- 21895 Pleasant Ridge Rd
- 21917 Pleasant Ridge Rd
- 21919 Pleasant Ridge Rd
- 21889 Meadow Mist Cir
- 2003 Pleasant Ridge Rd