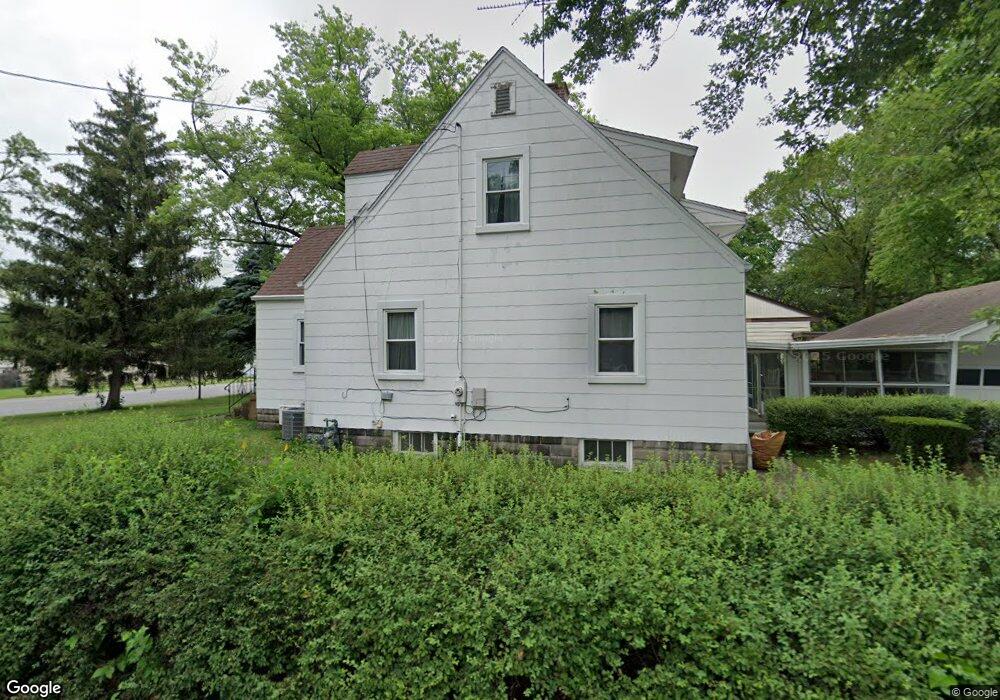
2001 Thornton Lansing Rd Lansing, IL 60438
Estimated Value: $178,000 - $214,072
4
Beds
2
Baths
1,026
Sq Ft
$186/Sq Ft
Est. Value
About This Home
This home is located at 2001 Thornton Lansing Rd, Lansing, IL 60438 and is currently estimated at $190,518, approximately $185 per square foot. 2001 Thornton Lansing Rd is a home located in Cook County with nearby schools including Oak Glen Elementary School, Memorial Jr High School, and Thornton Fractnl So High School.
Ownership History
Date
Name
Owned For
Owner Type
Purchase Details
Closed on
Mar 3, 2010
Sold by
Deutsche Bank National Trust Company
Bought by
Mayerak Jeremiah A
Current Estimated Value
Purchase Details
Closed on
Oct 28, 2009
Sold by
Fleming
Bought by
Deutsche Bank National Trust Company
Purchase Details
Closed on
Jan 5, 2007
Sold by
Fleming Joseph A and Francis Julie D
Bought by
Fleming Joseph A and Fleming Julie D
Home Financials for this Owner
Home Financials are based on the most recent Mortgage that was taken out on this home.
Original Mortgage
$146,800
Interest Rate
6.24%
Mortgage Type
New Conventional
Purchase Details
Closed on
Nov 1, 2004
Sold by
Raasch Larry
Bought by
Fleming Joseph B and Francis Julie D
Home Financials for this Owner
Home Financials are based on the most recent Mortgage that was taken out on this home.
Original Mortgage
$110,400
Interest Rate
6.5%
Mortgage Type
Unknown
Purchase Details
Closed on
Oct 15, 2002
Sold by
Thirion Gloria
Bought by
Raasch Larry
Create a Home Valuation Report for This Property
The Home Valuation Report is an in-depth analysis detailing your home's value as well as a comparison with similar homes in the area
Home Values in the Area
Average Home Value in this Area
Purchase History
| Date | Buyer | Sale Price | Title Company |
|---|---|---|---|
| Mayerak Jeremiah A | $41,500 | Ticor Title Insurance Co | |
| Deutsche Bank National Trust Company | -- | None Available | |
| Fleming Joseph A | -- | Netco | |
| Fleming Joseph B | $138,000 | Cti | |
| Raasch Larry | $92,500 | -- |
Source: Public Records
Mortgage History
| Date | Status | Borrower | Loan Amount |
|---|---|---|---|
| Previous Owner | Fleming Joseph A | $146,800 | |
| Previous Owner | Fleming Joseph B | $110,400 | |
| Closed | Fleming Joseph B | $27,600 |
Source: Public Records
Tax History Compared to Growth
Tax History
| Year | Tax Paid | Tax Assessment Tax Assessment Total Assessment is a certain percentage of the fair market value that is determined by local assessors to be the total taxable value of land and additions on the property. | Land | Improvement |
|---|---|---|---|---|
| 2024 | $3,774 | $10,475 | $6,990 | $3,485 |
| 2023 | $3,313 | $13,800 | $10,315 | $3,485 |
| 2022 | $3,313 | $10,320 | $9,101 | $1,219 |
| 2021 | $3,325 | $10,320 | $9,101 | $1,219 |
| 2020 | $3,175 | $10,320 | $9,101 | $1,219 |
| 2019 | $4,240 | $13,227 | $8,494 | $4,733 |
| 2018 | $4,199 | $13,227 | $8,494 | $4,733 |
| 2017 | $4,358 | $13,227 | $8,494 | $4,733 |
| 2016 | $4,414 | $12,663 | $7,887 | $4,776 |
| 2015 | $4,078 | $12,663 | $7,887 | $4,776 |
| 2014 | $5,125 | $12,663 | $7,887 | $4,776 |
| 2013 | $4,886 | $13,310 | $7,887 | $5,423 |
Source: Public Records
Map
Nearby Homes
- 2036 Thornton Lansing Rd
- 17934 Locust St
- 2201 Thornton Lansing Rd
- 17750 Clyde Ave
- 18038 Whitman Ln
- 17871 Locust St
- 1943 182nd St
- 2290 182nd Place
- 18020 Ridgeland Ave
- 18309 Bock Rd
- 18307 Locust St
- 18311 Holland Rd
- 18131 Crystal Ln
- 18036 Crystal Ln
- 18328 Country Ln
- 2307 177th St
- 1555 Thornton Lansing Rd
- 17001 Glen Oak Ave
- 2306 Holiday Terrace Unit 144
- 2306 Holiday Terrace Unit 163
- 2003 Thornton Lansing Rd
- 1999 Thornton Lansing Rd
- 2007 Thornton Lansing Rd
- 2006 Indiana Ave
- 1995 Indiana Ave
- 2009 Thornton Lansing Rd
- 2009 Thornton Lansing Rd
- 2006 Thornton Lansing Rd
- 2008 Thornton Lansing Rd
- 2002 Thornton Lansing Rd
- 2010 Indiana Ave
- 2013 Thornton Lansing Rd
- 2005 Indiana Ave
- 2016 Indiana Ave
- 1999 Indiana Ave
- 2009 Indiana Ave
- 2010 Thornton Lansing Rd
- 2010 Thornton Rd
- 2015 Thornton Lansing Rd
- 2012 Thornton Lansing Rd