2001 Walden Glade Run Apex, NC 27523
Beaver Creek NeighborhoodEstimated Value: $713,608 - $754,000
4
Beds
4
Baths
2,639
Sq Ft
$275/Sq Ft
Est. Value
About This Home
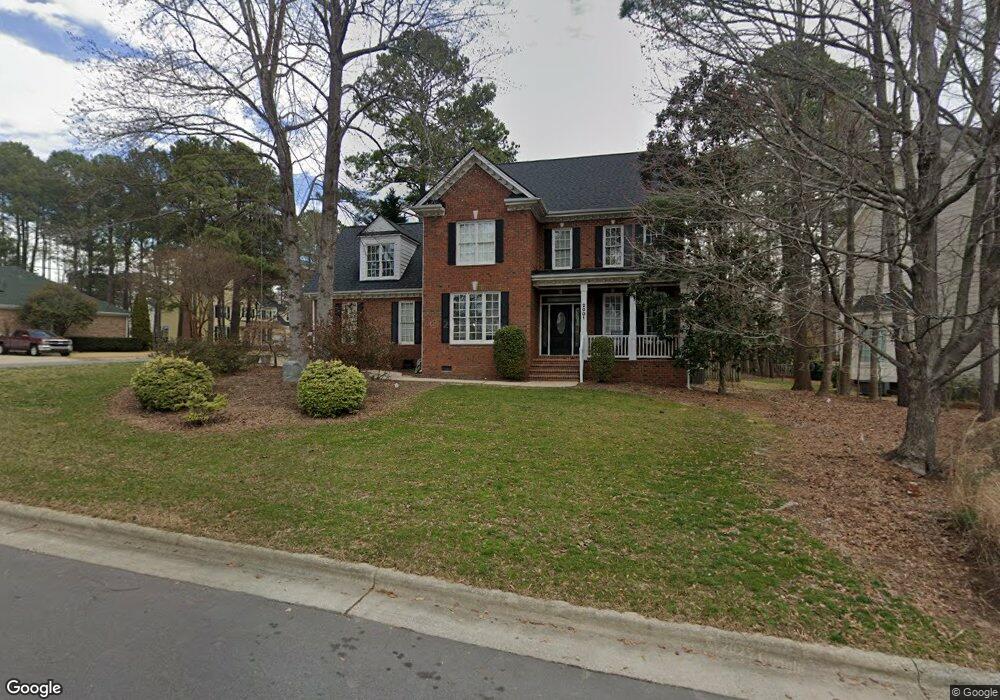
This home is located at 2001 Walden Glade Run, Apex, NC 27523 and is currently estimated at $725,152, approximately $274 per square foot. 2001 Walden Glade Run is a home located in Wake County with nearby schools including Turner Creek Elementary School, Salem Middle, and Green Level High School.
Ownership History
Date
Name
Owned For
Owner Type
Purchase Details
Closed on
Jun 16, 2011
Sold by
Brockman John F and Brockman Laura U
Bought by
Schall Michael Allen and Schall Sarah Anne
Current Estimated Value
Home Financials for this Owner
Home Financials are based on the most recent Mortgage that was taken out on this home.
Original Mortgage
$292,590
Outstanding Balance
$202,461
Interest Rate
4.71%
Mortgage Type
New Conventional
Estimated Equity
$522,691
Purchase Details
Closed on
Mar 30, 2001
Sold by
Crown Builders & Developers Inc
Bought by
Brockman John F and Brockman Laura U
Home Financials for this Owner
Home Financials are based on the most recent Mortgage that was taken out on this home.
Original Mortgage
$219,920
Interest Rate
5.87%
Create a Home Valuation Report for This Property
The Home Valuation Report is an in-depth analysis detailing your home's value as well as a comparison with similar homes in the area
Home Values in the Area
Average Home Value in this Area
Purchase History
| Date | Buyer | Sale Price | Title Company |
|---|---|---|---|
| Schall Michael Allen | $325,500 | None Available | |
| Brockman John F | $275,000 | -- |
Source: Public Records
Mortgage History
| Date | Status | Borrower | Loan Amount |
|---|---|---|---|
| Open | Schall Michael Allen | $292,590 | |
| Previous Owner | Brockman John F | $219,920 |
Source: Public Records
Tax History Compared to Growth
Tax History
| Year | Tax Paid | Tax Assessment Tax Assessment Total Assessment is a certain percentage of the fair market value that is determined by local assessors to be the total taxable value of land and additions on the property. | Land | Improvement |
|---|---|---|---|---|
| 2025 | $5,875 | $670,646 | $220,000 | $450,646 |
| 2024 | $5,744 | $670,646 | $220,000 | $450,646 |
| 2023 | $4,546 | $412,597 | $85,000 | $327,597 |
| 2022 | $4,268 | $412,597 | $85,000 | $327,597 |
| 2021 | $4,105 | $412,597 | $85,000 | $327,597 |
| 2020 | $4,063 | $412,597 | $85,000 | $327,597 |
| 2019 | $4,201 | $368,157 | $80,000 | $288,157 |
| 2018 | $3,957 | $359,361 | $80,000 | $279,361 |
| 2017 | $3,596 | $359,361 | $80,000 | $279,361 |
| 2016 | $3,544 | $359,361 | $80,000 | $279,361 |
| 2015 | $3,553 | $351,740 | $70,000 | $281,740 |
| 2014 | $3,425 | $351,740 | $70,000 | $281,740 |
Source: Public Records
Map
Nearby Homes
- 2300 Walden Creek Dr
- 1622 Shepherds Glade Dr
- 1633 Shepherds Glade Dr
- 2208 Good Shepherd Way
- 2201 Dial Dr
- 2060 Jersey City Place
- 2115 Grouse Ski Cir
- 2122 Grouse Ski Cir
- 2127 Grouse Ski Cir
- 2134 Grouse Ski Cir
- 831 Tunisian Dr
- 7242 Morris Acres Rd
- 2013 Keokuk Ct
- 479 Clark Creek Ln
- 2126 Whitesmith Dr
- 427 Eyam Hall Ln
- 1001 Drayman Place
- 1038 Brownsmith Dr
- 235 Eyam Hall Ln
- 232 Eyam Hall Ln
- 2003 Walden Glade Run
- 2221 Walden Creek Dr
- 2222 Walden Creek Dr
- 2009 Walden Glade Run
- 2000 Walden Glade Run
- 2219 Walden Creek Dr
- 2002 Walden Glade Run
- 2013 Walden Glade Run
- 2220 Walden Creek Dr
- 2013 Walden Glade Dr
- 2004 Walden Glade Dr
- 2004 Walden Glade Run
- 2302 Bristers Spring Way
- 2218 Walden Creek Dr
- 2217 Walden Creek Dr
- 2006 Walden Glade Run
- 2015 Walden Glade Run
- 1700 Green Hickory Ct
- 2008 Walden Glade Run
- 2303 Bristers Spring Way