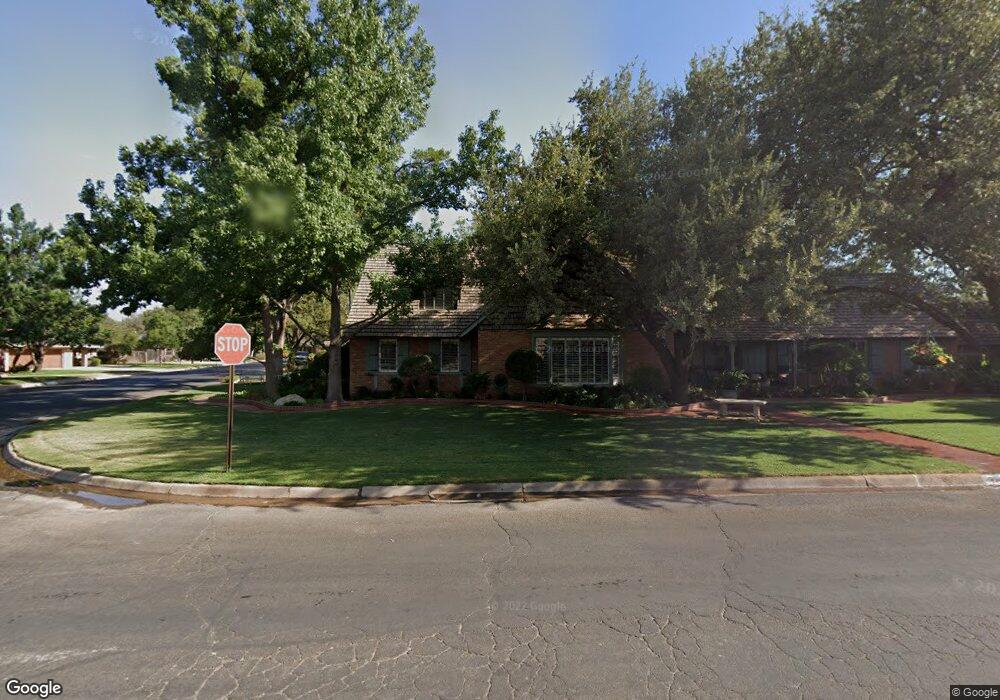
2001 Winfield Rd Midland, TX 79705
Estimated Value: $763,000 - $2,608,821
5
Beds
7
Baths
9,774
Sq Ft
$192/Sq Ft
Est. Value
About This Home
This home is located at 2001 Winfield Rd, Midland, TX 79705 and is currently estimated at $1,878,940, approximately $192 per square foot. 2001 Winfield Rd is a home located in Midland County with nearby schools including Fannin Elementary School, Midland High School, and The Hillander School.
Ownership History
Date
Name
Owned For
Owner Type
Purchase Details
Closed on
May 3, 2024
Sold by
Favrot Thomas B and Favrot Elizabeth B
Bought by
Rasmussen Harold James and Rasmussen Pamela B
Current Estimated Value
Purchase Details
Closed on
Oct 31, 2023
Sold by
Stirling Warren Walter
Bought by
Favrot Thomas B and Favrot Elizabeth B
Home Financials for this Owner
Home Financials are based on the most recent Mortgage that was taken out on this home.
Original Mortgage
$1,635,000
Interest Rate
7.19%
Mortgage Type
Seller Take Back
Purchase Details
Closed on
Feb 27, 2001
Sold by
Warren Johnny R
Bought by
Warren Carole V
Purchase Details
Closed on
Mar 1, 1994
Bought by
Warren Carole V
Purchase Details
Closed on
Feb 2, 1994
Bought by
Warren Carole V
Create a Home Valuation Report for This Property
The Home Valuation Report is an in-depth analysis detailing your home's value as well as a comparison with similar homes in the area
Home Values in the Area
Average Home Value in this Area
Purchase History
| Date | Buyer | Sale Price | Title Company |
|---|---|---|---|
| Rasmussen Harold James | -- | West Texas Abstract & Title | |
| Favrot Thomas B | -- | Lone Star Abstract & Title | |
| Warren Carole V | -- | -- | |
| Warren Carole V | -- | -- | |
| Warren Carole V | -- | -- |
Source: Public Records
Mortgage History
| Date | Status | Borrower | Loan Amount |
|---|---|---|---|
| Previous Owner | Favrot Thomas B | $1,635,000 |
Source: Public Records
Tax History Compared to Growth
Tax History
| Year | Tax Paid | Tax Assessment Tax Assessment Total Assessment is a certain percentage of the fair market value that is determined by local assessors to be the total taxable value of land and additions on the property. | Land | Improvement |
|---|---|---|---|---|
| 2025 | $23,688 | $1,534,360 | $96,800 | $1,437,560 |
| 2024 | $23,720 | $1,562,010 | $96,800 | $1,465,210 |
| 2023 | $22,718 | $1,515,930 | $96,800 | $1,419,130 |
| 2022 | $21,765 | $1,393,030 | $96,800 | $1,296,230 |
| 2021 | $24,269 | $1,393,030 | $96,800 | $1,296,230 |
| 2020 | $14,194 | $1,303,450 | $96,800 | $1,206,650 |
| 2019 | $24,677 | $1,303,450 | $96,800 | $1,206,650 |
| 2018 | $23,700 | $1,218,940 | $96,800 | $1,146,180 |
| 2017 | $21,546 | $1,108,130 | $96,800 | $1,011,330 |
| 2016 | $20,972 | $1,084,650 | $96,800 | $987,850 |
| 2015 | -- | $1,084,650 | $96,800 | $987,850 |
| 2014 | -- | $1,022,650 | $0 | $0 |
Source: Public Records
Map
Nearby Homes
- 1606 Shell Ave
- 1607 Shell Ave
- 1605 Shell Ave
- 1602 Winfield Rd
- 2016 Gulf Prairie Ln
- 1608 N L St
- 2207 Boyd Ave
- 1604 N N St
- 1901 N Garfield St
- 6716 S County Road 1160 Unit A
- 2003 Community Ln
- 1605 N I St
- 2011 Community Ln
- 2300 W Golf Course Rd
- 2000 Neely Ave
- 1210 W Scharbauer Dr
- 2109 Western Dr
- 1202 W Scharbauer Dr
- 1611 W Pecan Ave
- 1200 W Scharbauer Dr
- 2002 Shell Ave
- 2003 Winfield Rd
- 2004 Shell Ave
- 2000 Shell Ave
- 2000 Winfield Rd
- 1904 N L St
- 2006 Shell Ave
- 1902 N L St
- 2002 Winfield Rd
- 1906 N L St
- 1900 N L St
- 2003 Shell Ave
- 2007 Winfield Rd
- 2008 Shell Ave
- 1613 Winfield Rd
- 2001 Humble Ave
- 2005 Shell Ave
- 2001 Shell Ave
- 2003 Humble Ave
- 1612 Winfield Rd