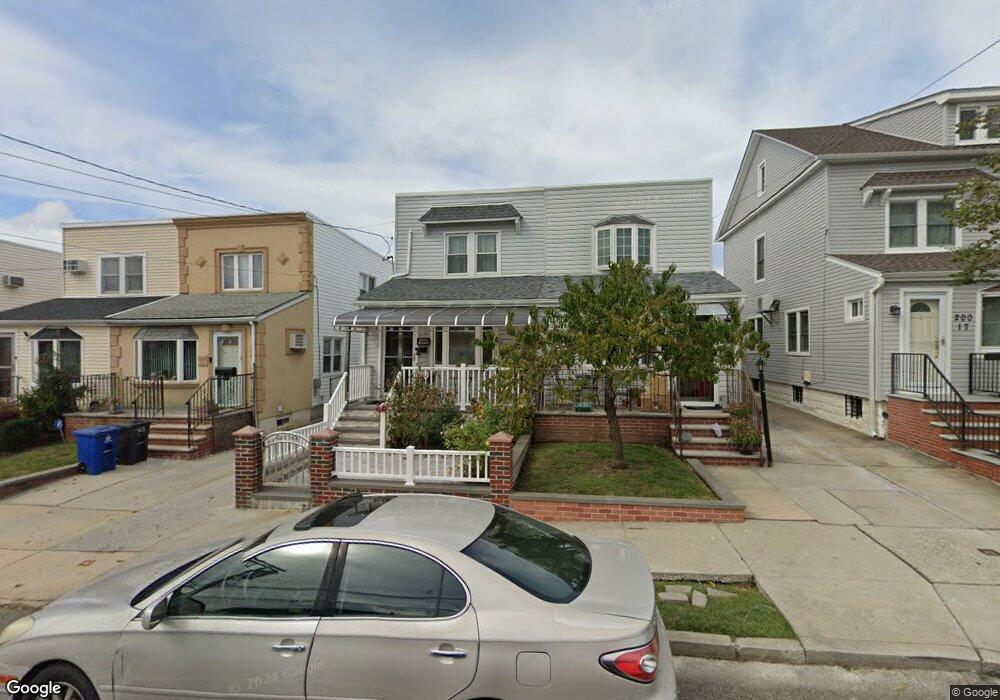
20013 33rd Ave Bayside, NY 11361
Auburndale NeighborhoodEstimated Value: $742,000 - $824,000
--
Bed
--
Bath
1,050
Sq Ft
$758/Sq Ft
Est. Value
About This Home
This home is located at 20013 33rd Ave, Bayside, NY 11361 and is currently estimated at $795,730, approximately $757 per square foot. 20013 33rd Ave is a home located in Queens County with nearby schools including P.S. 159 Queens, I.S. 25 Adrien Block, and Bayside High School.
Ownership History
Date
Name
Owned For
Owner Type
Purchase Details
Closed on
Jan 7, 2011
Sold by
Lin Ping and Lin Zong Hou
Bought by
Lin Ping
Current Estimated Value
Purchase Details
Closed on
Dec 19, 2006
Sold by
Li Heping and Zhong Ningzhen
Bought by
Lin Ping and Lin Zong Hou
Home Financials for this Owner
Home Financials are based on the most recent Mortgage that was taken out on this home.
Original Mortgage
$47,200
Interest Rate
6.24%
Purchase Details
Closed on
Jul 10, 2001
Sold by
Lorenz Peter A and Lorenz Mary K
Bought by
Zhong Ningzhen and Li Heping
Home Financials for this Owner
Home Financials are based on the most recent Mortgage that was taken out on this home.
Original Mortgage
$178,400
Interest Rate
7.18%
Mortgage Type
Purchase Money Mortgage
Create a Home Valuation Report for This Property
The Home Valuation Report is an in-depth analysis detailing your home's value as well as a comparison with similar homes in the area
Home Values in the Area
Average Home Value in this Area
Purchase History
| Date | Buyer | Sale Price | Title Company |
|---|---|---|---|
| Lin Ping | -- | -- | |
| Lin Ping | -- | -- | |
| Lin Ping | $472,000 | -- | |
| Lin Ping | $472,000 | -- | |
| Zhong Ningzhen | -- | -- | |
| Zhong Ningzhen | -- | -- |
Source: Public Records
Mortgage History
| Date | Status | Borrower | Loan Amount |
|---|---|---|---|
| Previous Owner | Lin Ping | $47,200 | |
| Previous Owner | Lin Ping | $377,600 | |
| Previous Owner | Zhong Ningzhen | $178,400 |
Source: Public Records
Tax History Compared to Growth
Tax History
| Year | Tax Paid | Tax Assessment Tax Assessment Total Assessment is a certain percentage of the fair market value that is determined by local assessors to be the total taxable value of land and additions on the property. | Land | Improvement |
|---|---|---|---|---|
| 2025 | $5,095 | $25,796 | $6,418 | $19,378 |
| 2024 | $5,095 | $25,367 | $7,558 | $17,809 |
| 2023 | $4,835 | $24,074 | $6,078 | $17,996 |
| 2022 | $4,548 | $43,020 | $12,300 | $30,720 |
| 2021 | $4,524 | $43,440 | $12,300 | $31,140 |
| 2020 | $4,550 | $43,920 | $12,300 | $31,620 |
| 2019 | $4,422 | $43,260 | $12,300 | $30,960 |
| 2018 | $4,090 | $20,062 | $6,337 | $13,725 |
| 2017 | $3,870 | $18,987 | $6,531 | $12,456 |
| 2016 | $3,581 | $18,987 | $6,531 | $12,456 |
| 2015 | $2,160 | $17,914 | $7,606 | $10,308 |
| 2014 | $2,160 | $17,616 | $8,081 | $9,535 |
Source: Public Records
Map
Nearby Homes
- 20015 33rd Ave
- 3321 201st St
- 20206 33rd Ave
- 200-14 34th Ave
- 32-28 202nd St
- 19934 34th Ave
- 3314 204th St
- 34-41 201st St
- 3335 204th St
- 3337 204th St
- 190-16 33rd Ave
- 203-07 35th Ave Unit B
- 3211 204th St
- 35-16 203rd St
- 35-05 204th St Unit 245
- 20520 33rd Ave
- 204-8 35th Ave Unit 247
- 204-12 35th Ave Unit 254
- 35-27 203rd St
- 35-12 205th St Unit 259