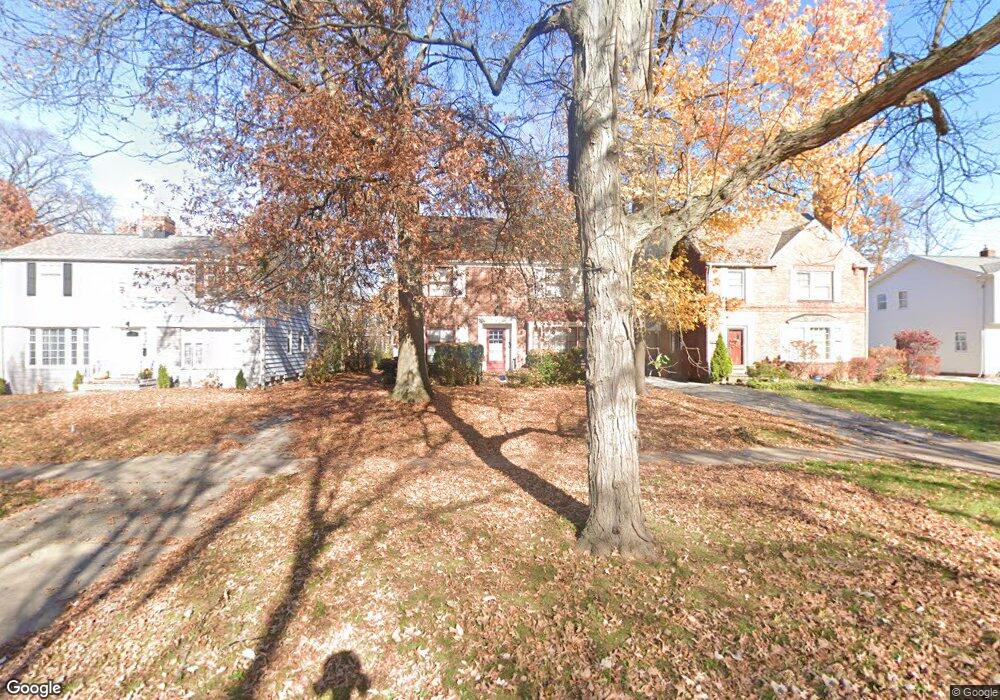
20013 Scottsdale Blvd Shaker Heights, OH 44122
Estimated Value: $288,000 - $327,314
3
Beds
3
Baths
2,128
Sq Ft
$145/Sq Ft
Est. Value
About This Home
This home is located at 20013 Scottsdale Blvd, Shaker Heights, OH 44122 and is currently estimated at $308,329, approximately $144 per square foot. 20013 Scottsdale Blvd is a home located in Cuyahoga County with nearby schools including Lomond Elementary School, Woodbury Elementary School, and Shaker Heights Middle School.
Ownership History
Date
Name
Owned For
Owner Type
Purchase Details
Closed on
Nov 17, 2021
Sold by
Royalty Properties & Investments
Bought by
Newberry-Smith Wendy and Newberry Robert S
Current Estimated Value
Purchase Details
Closed on
Oct 15, 2021
Sold by
Newberry Robert S and Newberry Ronald S
Bought by
Royalty Properties & Investments
Purchase Details
Closed on
Aug 6, 2016
Sold by
Estate Of Estus Sherman Newberry Jr
Bought by
Newberry Robert S and Newberry Ronald S
Purchase Details
Closed on
Apr 11, 2014
Sold by
Estate Of Elvira Y Newberry
Bought by
Newberry Estus S
Purchase Details
Closed on
Jan 1, 1975
Bought by
Newberry Estus S and Newberry Elvira Y
Create a Home Valuation Report for This Property
The Home Valuation Report is an in-depth analysis detailing your home's value as well as a comparison with similar homes in the area
Home Values in the Area
Average Home Value in this Area
Purchase History
| Date | Buyer | Sale Price | Title Company |
|---|---|---|---|
| Newberry-Smith Wendy | $192,000 | Harrison Terez | |
| Royalty Properties & Investments | $130,000 | None Available | |
| Newberry Robert S | -- | None Available | |
| Newberry Estus S | -- | None Available | |
| Newberry Estus S | -- | -- |
Source: Public Records
Tax History Compared to Growth
Tax History
| Year | Tax Paid | Tax Assessment Tax Assessment Total Assessment is a certain percentage of the fair market value that is determined by local assessors to be the total taxable value of land and additions on the property. | Land | Improvement |
|---|---|---|---|---|
| 2024 | $6,330 | $67,200 | $16,240 | $50,960 |
| 2023 | $9,007 | $73,960 | $13,090 | $60,870 |
| 2022 | $8,437 | $73,955 | $13,090 | $60,865 |
| 2021 | $8,222 | $73,960 | $13,090 | $60,870 |
| 2020 | $9,986 | $67,240 | $11,900 | $55,340 |
| 2019 | $7,690 | $192,100 | $34,000 | $158,100 |
| 2018 | $7,734 | $67,240 | $11,900 | $55,340 |
| 2017 | $8,077 | $63,640 | $11,800 | $51,840 |
| 2016 | $7,388 | $63,640 | $11,800 | $51,840 |
| 2015 | $7,508 | $63,640 | $11,800 | $51,840 |
| 2014 | $7,508 | $62,370 | $11,550 | $50,820 |
Source: Public Records
Map
Nearby Homes
- 19901 Lanbury Ave
- 3676 Rawnsdale Rd
- 19912 Lanbury Ave
- 3651 Rawnsdale Rd
- 3665 Sutherland Rd
- 3696 Tolland Rd
- 3635 Tolland Rd
- 3683 Stoer Rd
- 20516 Amherst Rd
- 19302 Shakerwood Rd
- 20511 Balfour Rd
- 19110 Lanbury Ave
- 3609 Stoer Rd
- 19024 Lomond Blvd
- 19708 Sunset Dr
- 19635 Chagrin Blvd
- 19207 Kings Hwy
- 20614 Kings Hwy
- 19627 Winslow Rd
- 19112 Kings Hwy
- 20019 Scottsdale Blvd
- 20005 Scottsdale Blvd
- 3725 Traynham Rd
- 20025 Scottsdale Blvd
- 3721 Traynham Rd
- 3726 Traver Rd
- 20029 Scottsdale Blvd
- 19829 Scottsdale Blvd
- 3722 Traver Rd
- 3715 Traynham Rd
- 19825 Scottsdale Blvd
- 3726 Traynham Rd
- 20014 Scottsdale Blvd
- 20020 Scottsdale Blvd
- 3716 Traver Rd
- 20006 Scottsdale Blvd
- 3722 Traynham Rd
- 20030 Scottsdale Blvd
- 3711 Traynham Rd
- 20105 Scottsdale Blvd