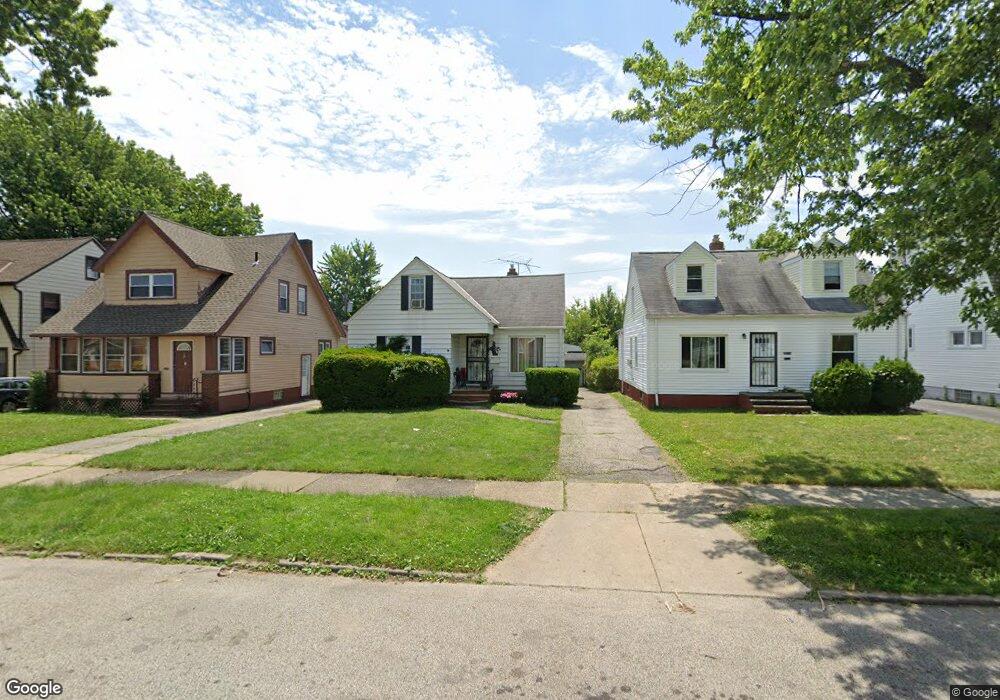
20014 Gardenview Dr Maple Heights, OH 44137
Estimated Value: $127,742 - $140,000
3
Beds
1
Bath
1,224
Sq Ft
$110/Sq Ft
Est. Value
About This Home
This home is located at 20014 Gardenview Dr, Maple Heights, OH 44137 and is currently estimated at $134,936, approximately $110 per square foot. 20014 Gardenview Dr is a home located in Cuyahoga County with nearby schools including Abraham Lincoln Elementary School, Rockside/ J.F. Kennedy School, and Barack Obama School.
Ownership History
Date
Name
Owned For
Owner Type
Purchase Details
Closed on
Jul 31, 2007
Sold by
Oliver Adrianne R and Jefferson Raheem
Bought by
Searcy Demetria
Current Estimated Value
Home Financials for this Owner
Home Financials are based on the most recent Mortgage that was taken out on this home.
Original Mortgage
$89,594
Outstanding Balance
$56,871
Interest Rate
6.71%
Mortgage Type
FHA
Estimated Equity
$78,065
Purchase Details
Closed on
Sep 14, 1992
Sold by
Kabat Jerome F
Bought by
Oliver Adriane R
Purchase Details
Closed on
Jul 25, 1985
Sold by
Kubat Jerome F and Kubat Rosemarie
Bought by
Kabat Jerome F
Purchase Details
Closed on
May 4, 1982
Sold by
Cefaratti Mike A and Cefaratti Jeanne M
Bought by
Kubat Jerome F and Kubat Rosemarie
Purchase Details
Closed on
Jan 1, 1975
Bought by
Cefaratti Mike A and Cefaratti Jeanne M
Create a Home Valuation Report for This Property
The Home Valuation Report is an in-depth analysis detailing your home's value as well as a comparison with similar homes in the area
Home Values in the Area
Average Home Value in this Area
Purchase History
| Date | Buyer | Sale Price | Title Company |
|---|---|---|---|
| Searcy Demetria | $91,000 | Attorney | |
| Oliver Adriane R | $55,000 | -- | |
| Kabat Jerome F | -- | -- | |
| Kubat Jerome F | $48,000 | -- | |
| Cefaratti Mike A | -- | -- |
Source: Public Records
Mortgage History
| Date | Status | Borrower | Loan Amount |
|---|---|---|---|
| Open | Searcy Demetria | $89,594 |
Source: Public Records
Tax History
| Year | Tax Paid | Tax Assessment Tax Assessment Total Assessment is a certain percentage of the fair market value that is determined by local assessors to be the total taxable value of land and additions on the property. | Land | Improvement |
|---|---|---|---|---|
| 2024 | $3,389 | $37,835 | $7,000 | $30,835 |
| 2023 | $3,617 | $22,550 | $4,240 | $18,310 |
| 2022 | $2,394 | $22,540 | $4,240 | $18,310 |
| 2021 | $2,552 | $22,540 | $4,240 | $18,310 |
| 2020 | $2,179 | $17,080 | $3,220 | $13,860 |
| 2019 | $2,168 | $48,800 | $9,200 | $39,600 |
| 2018 | $1,078 | $17,080 | $3,220 | $13,860 |
| 2017 | $2,103 | $16,210 | $2,980 | $13,230 |
| 2016 | $2,035 | $16,210 | $2,980 | $13,230 |
| 2015 | $2,038 | $16,210 | $2,980 | $13,230 |
| 2014 | $2,038 | $17,820 | $3,260 | $14,560 |
Source: Public Records
Map
Nearby Homes
- 5147 Warrensville Center Rd
- 19520 Maple Heights Blvd
- 19931 Raymond St
- 19289 Stafford Ave
- 20806 Clare Ave
- 20517 Raymond St
- 5165 Camden Rd
- 20905 Clare Ave
- 20600 Watson Rd
- 20715 Watson Rd
- 5194 Homewood Ave
- 21202 Gardenview Dr
- 20705 Hansen Rd
- 21202 Hillgrove Ave
- 18990 Raymond St
- 21207 Franklin Rd
- 18909 Maple Heights Blvd
- 18715 Libby Rd
- 18851 Raymond St
- 5409 Hollywood Ave
- 20100 Gardenview Dr
- 20010 Gardenview Dr
- 20104 Gardenview Dr
- 20004 Gardenview Dr
- 20106 Gardenview Dr
- 20000 Gardenview Dr
- 20015 Mountville Dr
- 20019 Mountville Dr
- 20011 Mountville Dr
- 20103 Mountville Dr
- 20005 Mountville Dr
- 20110 Gardenview Dr
- 19916 Gardenview Dr
- 20003 Mountville Dr
- 20107 Mountville Dr
- 20015 Gardenview Dr
- 20019 Gardenview Dr
- 20011 Gardenview Dr
- 20101 Gardenview Dr
- 20007 Gardenview Dr
Your Personal Tour Guide
Ask me questions while you tour the home.