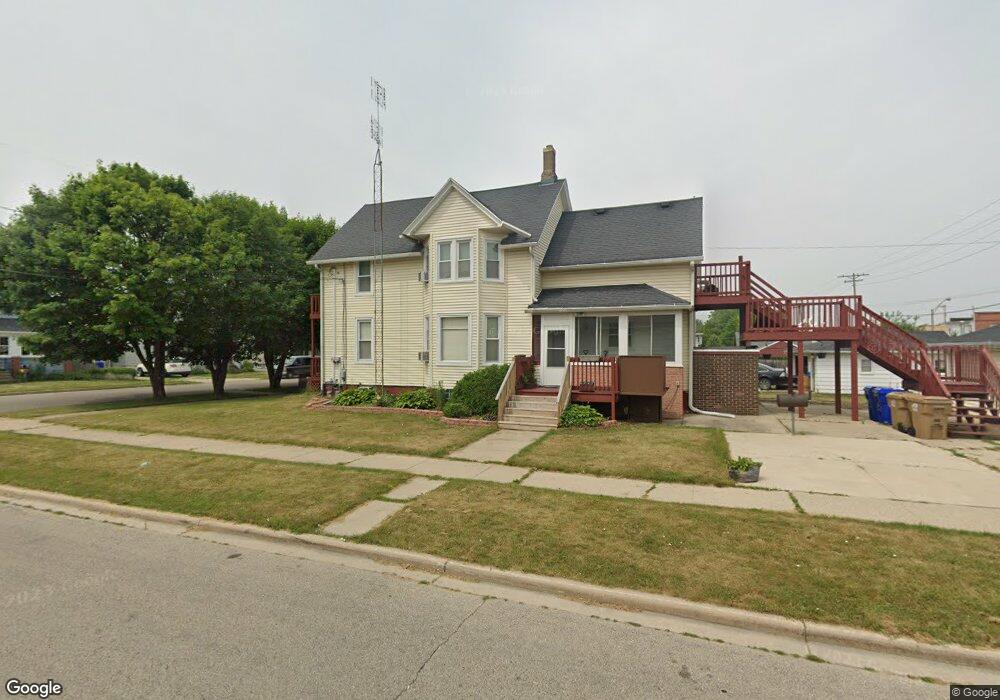
2002 53rd St Kenosha, WI 53140
Columbia NeighborhoodEstimated Value: $186,861 - $255,000
5
Beds
2
Baths
1,932
Sq Ft
$117/Sq Ft
Est. Value
About This Home
This home is located at 2002 53rd St, Kenosha, WI 53140 and is currently estimated at $225,965, approximately $116 per square foot. 2002 53rd St is a home located in Kenosha County with nearby schools including Frank Elementary School, Washington Middle School, and Bradford High School.
Ownership History
Date
Name
Owned For
Owner Type
Purchase Details
Closed on
Aug 31, 2020
Sold by
Jullana Patrick A and Jullana Marllyn K
Bought by
Convergence Properties Llc
Current Estimated Value
Home Financials for this Owner
Home Financials are based on the most recent Mortgage that was taken out on this home.
Original Mortgage
$120,000
Outstanding Balance
$105,276
Interest Rate
2.9%
Mortgage Type
Commercial
Estimated Equity
$120,689
Purchase Details
Closed on
Sep 29, 2009
Sold by
Coppola Salvatore G
Bought by
Juliana Michelle M
Create a Home Valuation Report for This Property
The Home Valuation Report is an in-depth analysis detailing your home's value as well as a comparison with similar homes in the area
Home Values in the Area
Average Home Value in this Area
Purchase History
| Date | Buyer | Sale Price | Title Company |
|---|---|---|---|
| Convergence Properties Llc | $160,000 | None Available | |
| Juliana Michelle M | $131,200 | -- |
Source: Public Records
Mortgage History
| Date | Status | Borrower | Loan Amount |
|---|---|---|---|
| Open | Convergence Properties Llc | $120,000 |
Source: Public Records
Tax History
| Year | Tax Paid | Tax Assessment Tax Assessment Total Assessment is a certain percentage of the fair market value that is determined by local assessors to be the total taxable value of land and additions on the property. | Land | Improvement |
|---|---|---|---|---|
| 2025 | $2,646 | $158,300 | $20,500 | $137,800 |
| 2024 | $2,207 | $90,800 | $14,000 | $76,800 |
| 2023 | $2,207 | $90,800 | $14,000 | $76,800 |
| 2022 | $2,227 | $90,800 | $14,000 | $76,800 |
| 2021 | $2,512 | $90,800 | $14,000 | $76,800 |
| 2020 | $1,817 | $76,800 | $14,000 | $62,800 |
| 2019 | $1,737 | $76,800 | $14,000 | $62,800 |
| 2018 | $1,709 | $70,900 | $14,000 | $56,900 |
| 2017 | $1,766 | $70,900 | $14,000 | $56,900 |
| 2016 | $1,721 | $70,900 | $14,000 | $56,900 |
| 2015 | $1,847 | $72,400 | $15,000 | $57,400 |
| 2014 | $1,828 | $72,400 | $15,000 | $57,400 |
Source: Public Records
Map
Nearby Homes
Your Personal Tour Guide
Ask me questions while you tour the home.